FIGURE 2.

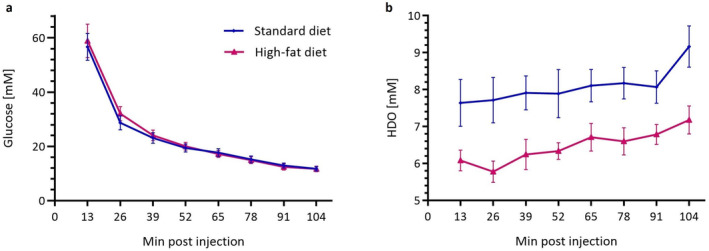
Intrahepatic glucose concentration (a) and rise in HDO (b) over a time course of 104 minutes in rodents fed SD (n = 9, blue) or HFD (n = 9, purple). Data are mean ± SEM.

Intrahepatic glucose concentration (a) and rise in HDO (b) over a time course of 104 minutes in rodents fed SD (n = 9, blue) or HFD (n = 9, purple). Data are mean ± SEM.