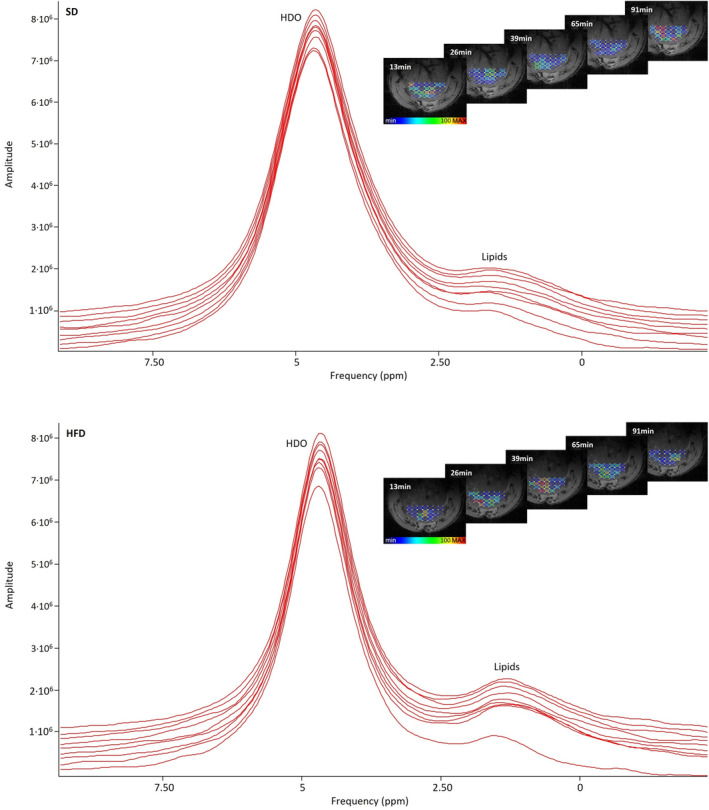
FIGURE 4.

Nonlocalized 2H MR spectra after palmitic acid injection in a representative animal on SD (top) and HFD (bottom). The spectrum in the front shows the baseline signal. The HDO peaks rise only very slightly over time. As the lipid peak is relatively small and the little changes over time are not well visible in the noisier localized spectra, the spectra of the nonlocalized measurements are shown for better clarity. For the sake of completeness, the right side displays amplitudes of lipid signals of the localized 2H MRSI voxels co‐registered with liver parenchyma for the same exemplary animal over time.
