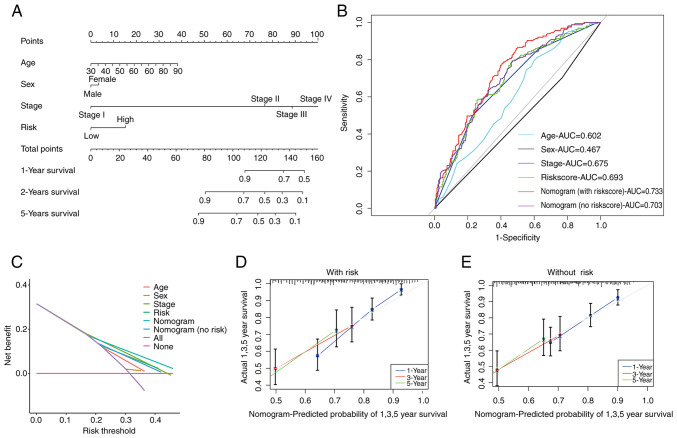
Figure 6.
Development of a nomogram and the predictive performance of the signature. (A) Forecast analysis of nomogram for 1-, 3- and 5-years. (B) Receiver operating characteristic curves that include diverse clinical data. (C) Decision curve analysis. (D and E) Calibration curves for 1-, 3- and 5-year nomogram (D) with risk score and (E) without risk score. AUC, area under the curve.

