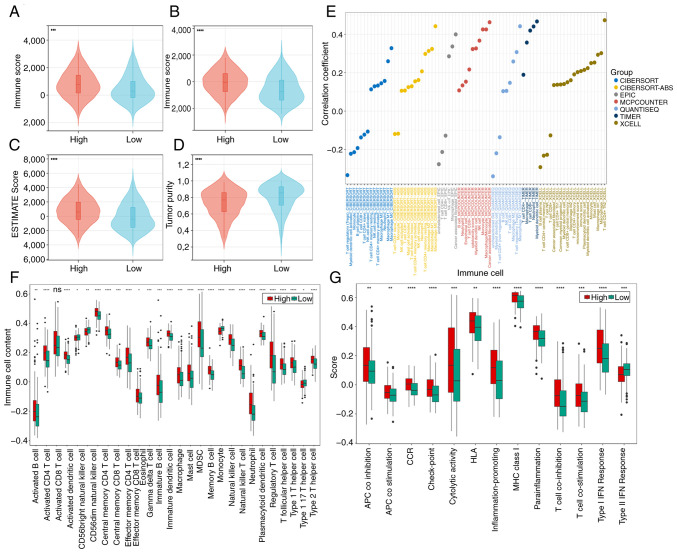
Figure 8.
Immune infiltration landscape analysis. (A-D) Violin plots of differences in the microenvironment between the two groups. (E) The correlation between immune cells and risk scores under seven algorithms. (F) Single-sample gene set enrichment analysis evaluation of 28 immune cell infiltrations and (G) 13 immune function scores. *P<0.05, **P<0.01, ***P<0.001 and ****P<0.0001. ns, not significant (P>0.05).

