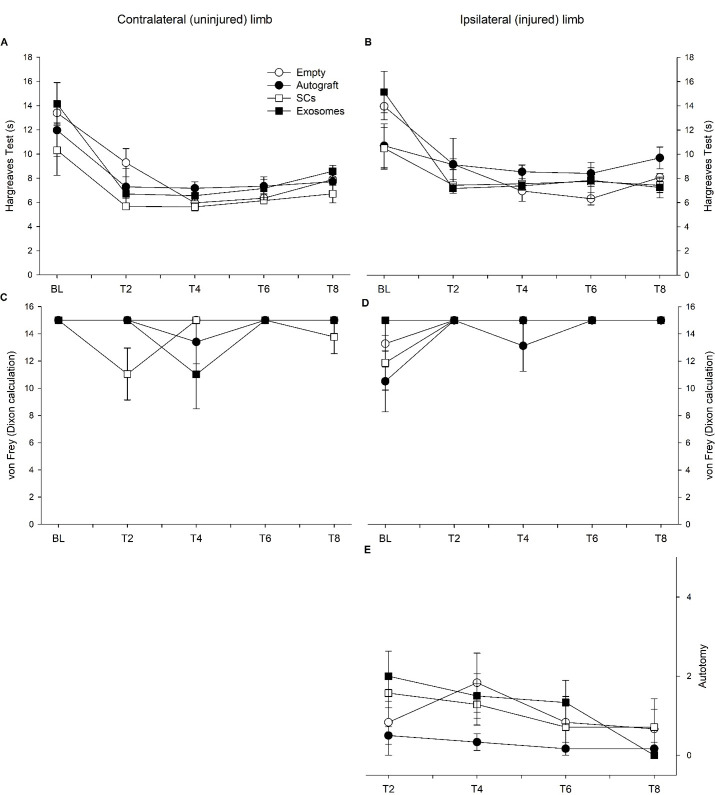
Fig 2.
Reaction times for the Hargreaves test are plotted for the contralateral/uninjured (A) and ipsilateral/injured (B) limb across five timepoints: baseline (BL), 4-week (T2), 8-week (T4), 12-week (T6), and 16-week (T8) post-injury for each treatment condition. Additionally, von Frey scores are plotted for the contralateral (C) and ipsilateral (D) limb across five timepoints for each treatment condition. Autotomy scores are plotted for each group across four timepoints (E) and a significant effect of timepoint was observed (p = 0.041). Note: error bars represents SEM.

