. 2025 Jan 7;13:RP98992. doi: 10.7554/eLife.98992

Figure 2. SAP54 plants display a dramatically altered leaf response to male leafhoppers by transcriptionally downregulating the majority of biotic stress and plant defence related processes.

(A-B) Euler-Venn diagrams illustrating DEGs in leaves of GFP plants (A) and SAP54 plants (B) exposed to female leafhoppers compared to male leafhoppers, versus leaves of plants in the control group (cage-only, non-exposed plants). DEG analysis was performed on 17,153 leaf-expressed genes available in Supplementary file 1. DEG IDs listed within each Venn diagram are provided in Supplementary file 2. (C-D). MapMan diagrams of A. thaliana DEGs involved in biotic stress from female (red insect) or male (blue insect) exposed GFP (C) or SAP54 plants (D). Biotic stress related pathways were significantly enriched with DEGs from male exposed SAP54 plants compared to other functions listed in Supplementary file 3. Names of functional bins (e.g. respiratory burst or MAPK) are listed next to the corresponding color boxes and fully listed in Supplementary file 4 along with individual transcript names and their fold changes. Red color boxes indicate upregulated, but green – downregulated DEGs based on log2(fold change).

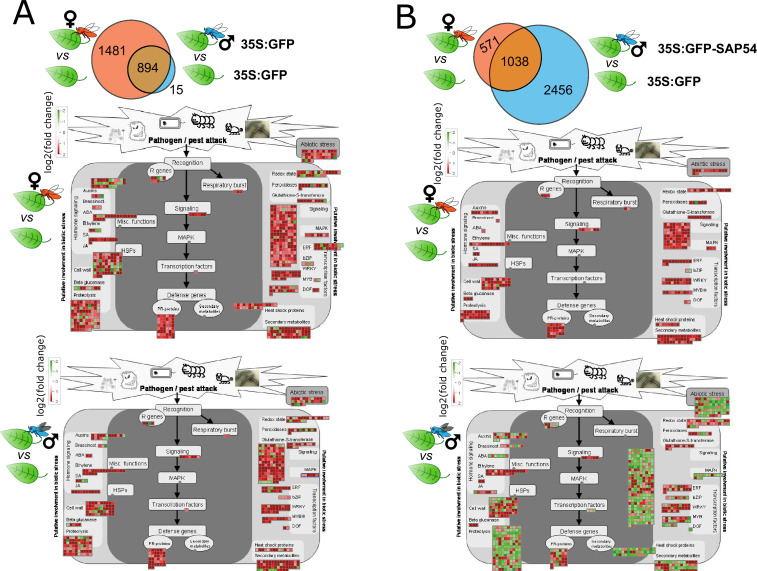
Figure 2.

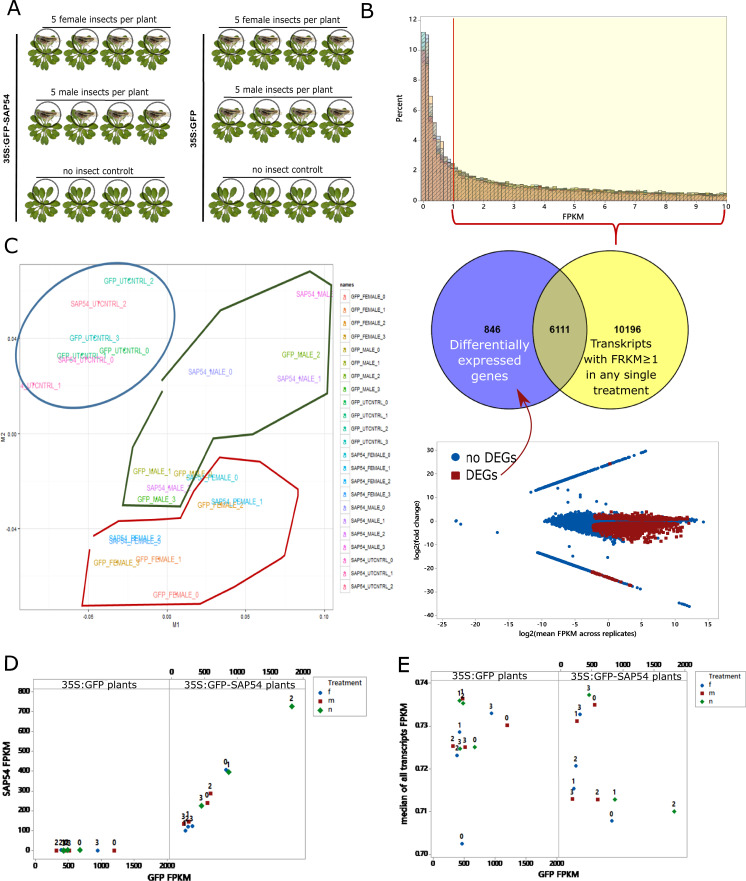
Figure 2—figure supplement 1. Experimental design and selection of transcripts for downstream analysis.

Figure 2—figure supplement 1.

(A) Five male or five female M. quadrilineatus individuals were placed within a clip-cage onto a single rosette leaf of 35 S:GFP-SAP54 or 35 S:GFP plants. Empty clip-cages without insects served as controls. (B). Mapped SAP54 reads plotted against GFP reads and color coded for treatments (m=male; f=female; n=no insect) on GFP and SAP54 plants. (C) Multi-dimensional analysis (MDA) plot demonstrates grouping of cDNA libraries according to treatment. (D) Transcripts with normalized read count (FRKM) ≥1 in any of the sequenced libraries (10,196) and significantly differentially expressed transcripts (DEGs) from any of the treatment pairwise comparisons (6947) were considered for downstream analysis (total = 17,153 transcripts).(E). Median of all transcript FRKM plotted against GFP reads and color coded for treatments (m=male; f=female; n=no insect) on GFP and SAP54 plants.
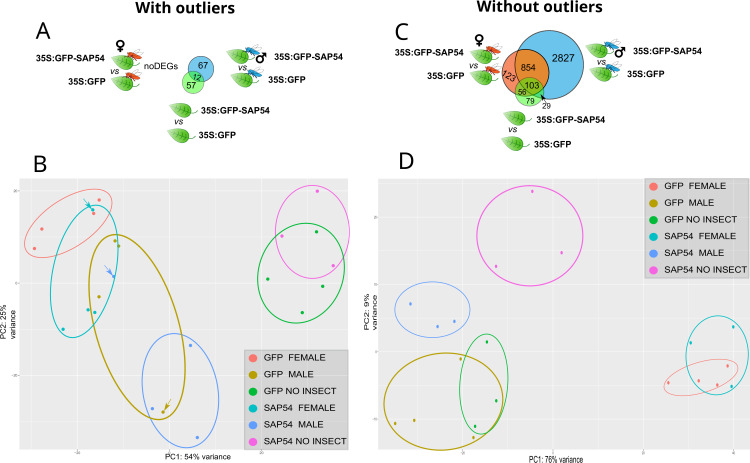
Figure 2—figure supplement 2. Biological variation and role of outliers in separation of treatments and identification of differentially expressed genes.

Figure 2—figure supplement 2.

Euler-Venn diagrams illustrating DEGs that differentiate SAP54 and GFP plants exposed to female or male or no leafhoppers when outliers are retained (A) or removed (B). Principal component analysis (PCA) plots illustrate variation within and among treatments when outliers are retained (C) or removed (D). Arrows in (C) indicate the outliers (SAP54_male, GFP_male, SAP54_female) that were removed in panel (D).
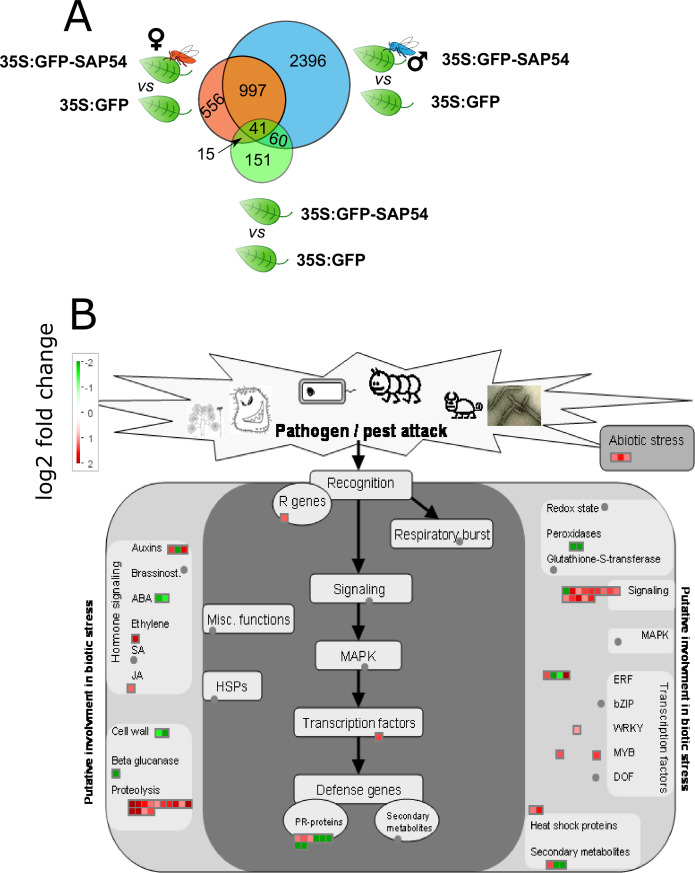
Figure 2—figure supplement 3. The cage-only SAP54 vs cage-only GFP treatments show a limited number of biotic stress DEGs.

Figure 2—figure supplement 3.

(A) Euler-Venn diagrams illustrating DEGs in SAP54 plants exposed to female or male or no leafhoppers compared to no insect exposed (empty cage-only) GFP plants. (B) Mapman diagram of DEGs involved in biotic stress in the cage-only SAP54 vs cage-only GFP plants. Pathways are indicated and each square is a gene with red versus green shades illustrating the level of up- or downregulation.