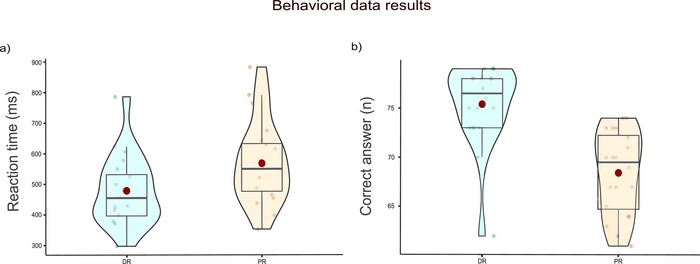
FIGURE 3.

Behavioral data results. (a) The reaction time in DR (M = 479, SD = 25.3) and PR (M = 568, SD = 30.3), and (b) the number of correct answers in DR (M = 75.4, SD = 0.919) and PR (M = 68.4, SD = 0.939). Each small dot represents the values of the participants. Big red dots represent the mean value. Bold black lines in the middle of the boxes represent the median value.
