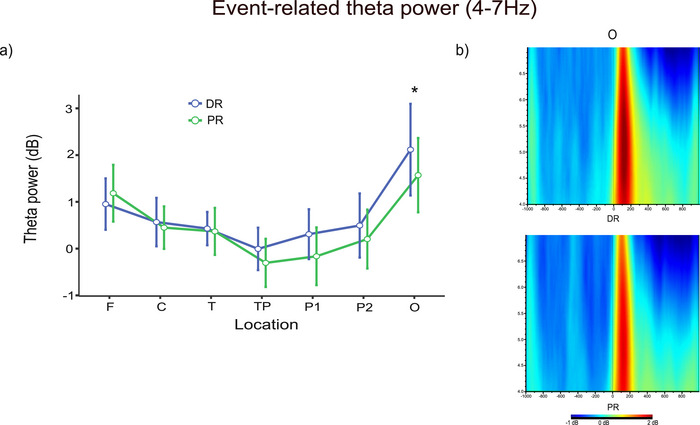
FIGURE 5.

Event‐related theta power results. (a) Theta power results of reasoning type and location interaction (p < 0.05). (b) The grand average figures of event‐related theta power analysis (4–7 Hz) for O locations in the time‐frequency domain during DR (top) and PR (bottom). The red color indicates high power, and the blue color indicates low power. Asterisks indicate significant results.
