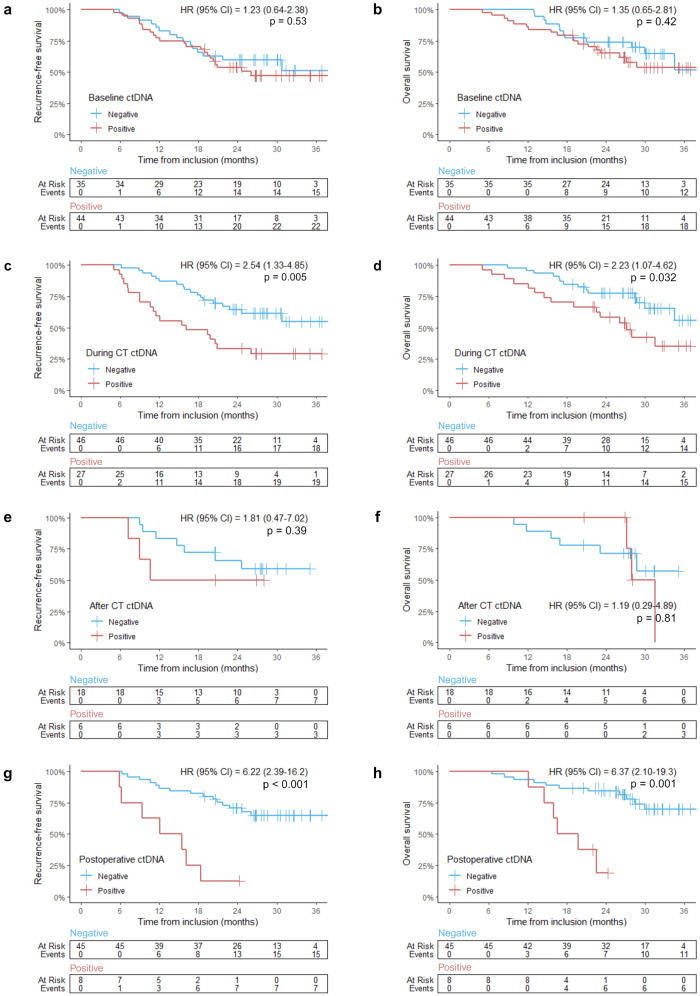
Fig. 3.
Kaplan–Meier analysis in the 86 patients with plasma analyzed for ctDNA. Red curves represent patients with detected ctDNA, while blue curves show patients without detected ctDNA. Vertical tick-marks indicate censoring. Number of events and at-risk patients are provided below each graph. a, c, e, f Recurrence-free survival (RFS) and b, d, f, g overall survival (OS) for patients with ctDNA analyses available at a, b baseline, c, d after one cycle of chemotherapy (CT), e, f after preoperative CT, and g, h after surgery. HR Hazard Ratio; ctDNA circulating tumor DNA; CT chemotherapy

