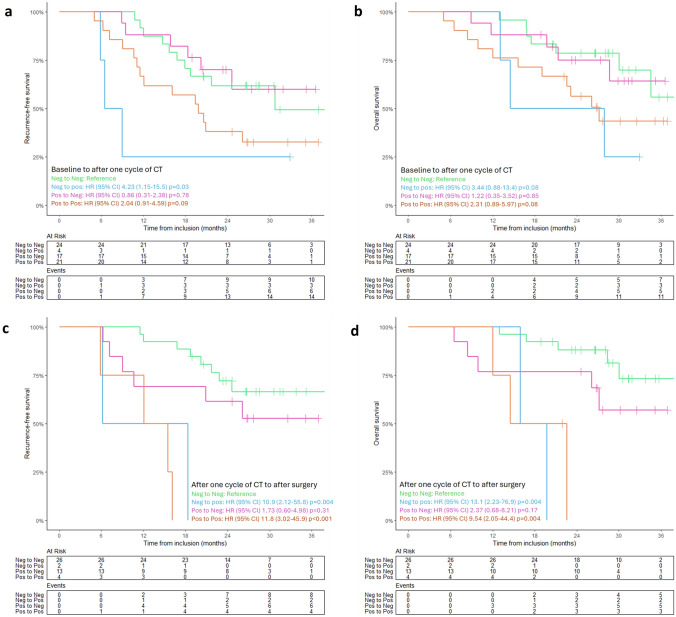
Fig. 4.
Kaplan–Meier analysis in four patient groups based on changes in ctDNA status during treatment: ‘negative to negative’ (green); ‘negative to positive’ (blue); ‘positive to negative’ (purple); ‘positive to positive’ (orange). a, c Recurrence-free survival (RFS) and overall survival (OS) (b, d) for ctDNA status transitions from baseline to after one cycle of chemotherapy (CT) (a, b) and ctDNA status transitions from after one cycle of CT to after surgical resection (c, d). Number of events and at-risk patients are provided below each graph. Vertical tick-marks indicate censoring. ctDNA circulating tumor DNA; CT chemotherapy

