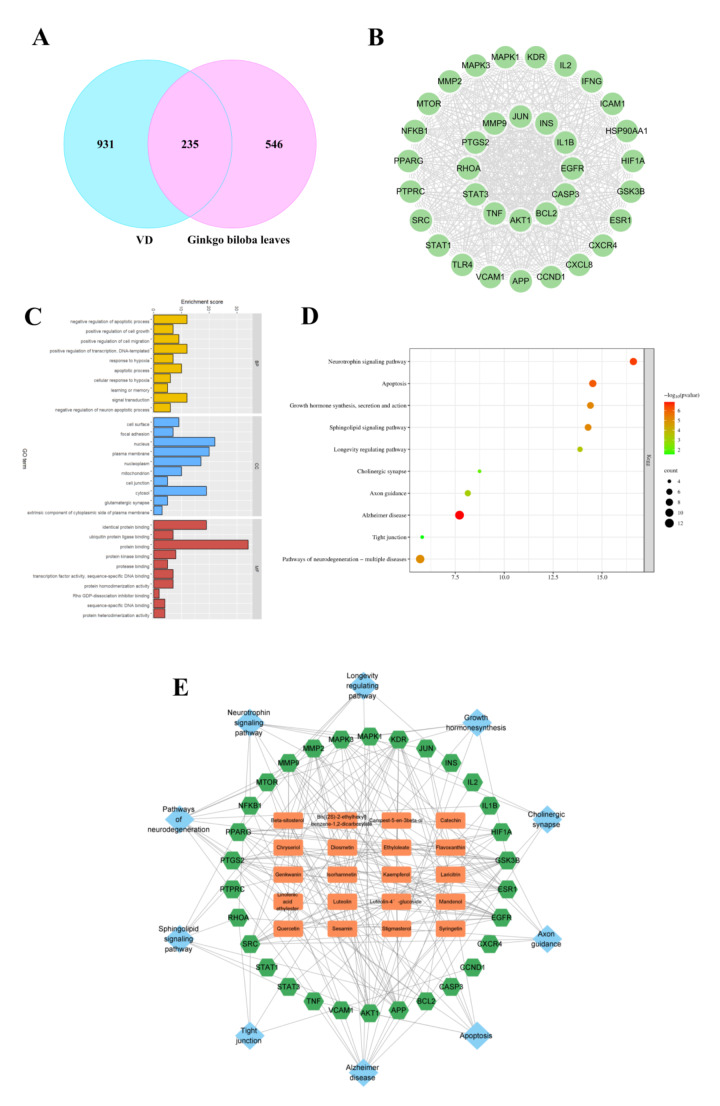
Fig. 1.
Identification of core targets of Ginkgo biloba for the alleviation of VD, and GO and KEGG inspections. A Venn diagram illustrating 235 intersected targets between the bioactive constituents of EGb761 and their relevant VD associated targets. B PPI network interlaced by the relatively pivotal targets. C Bar chart of GO analysis, the bar height represents enrichment score of each section. D Enrichment chart of KEGG analysis. Magnitudes of dots indicate target gene counts of each pathway, and dot colour depicts the related P adjusted values. E The “compound-target-pathway” network

