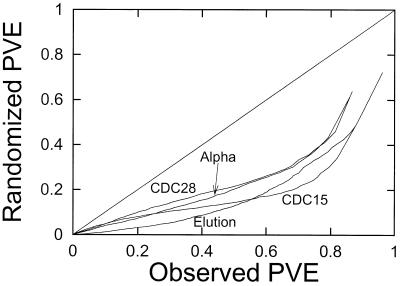
Figure 1.
Cyclicity of expression following different synchronization methods. For each experiment, the 1000 genes with the highest standard deviation in experimental values (using the raw data) were determined. For each of these 1000 genes the Fourier-PVE was calculated. These values were also determined for a randomized data set derived from the experimental values. The randomized data set (construction described in Materials and Methods) was produced by a randomization of the values for each gene. This produces two lists of numbers, both of which were sorted from least to greatest. The cyclicity values for each rank of gene in order is plotted for the experimental values against the randomized values. The cyclicity in each of the four experiments is therefore compared with the cyclicity in its randomized counterpart. Since the points fall below the diagonal line, this graph shows that there is more cyclicity present in the experimental values than can be explained as arising from chance fluctuations in the measurement process.

