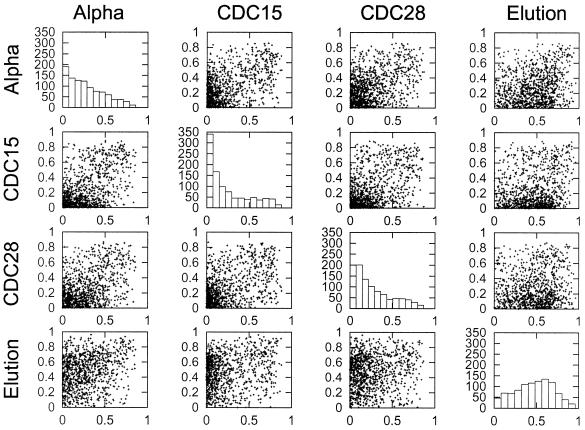
Figure 2.
Reproducibility of cyclicity between different experiments. For each distinct pair of synchronization methods used to analyze the cell cycle (1), the cyclicity levels for the 1000 genes with the highest standard deviations for one of the experiments are presented as a scatter plot. Thus, for the first line of four boxes, the 1000 genes in the α-factor experiment were identified, and their cyclicities in the α-factor experiment are compared with the cyclicities in the other three experiments. The four diagonal graphs are histograms showing the marginal level of cyclicity in each experiment for all 1000 genes for the selected experiment (listed at the left).

