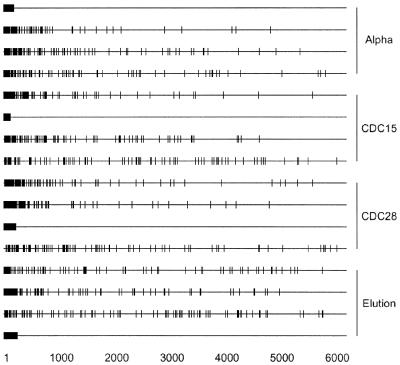
Figure 4.
Reproducibility of cyclicity for specific genes for different synchronization experiments. In each panel of four lines are displayed the 100 most cyclic genes from a given synchronization method (1). Each vertical dash indicates the rank cyclicity for a single gene in a single experiment. The first line is the location of the 100 most cyclic genes for the α-factor experiment. Lines 2–4 are the particular genes from line 1 and their relative cyclicity for synchronization by CDC15 arrest, CDC28 arrest and elution. Thus rank cyclicities of genes selected for high cyclicity for one synchronization method are shown for all four synchronization methods. Similarly, the remaining 12 lines are comparative analyses of the data for high cyclicity genes from the CDC15, CDC28 and elution experiments compared with the same genes analyzed by different methods.

