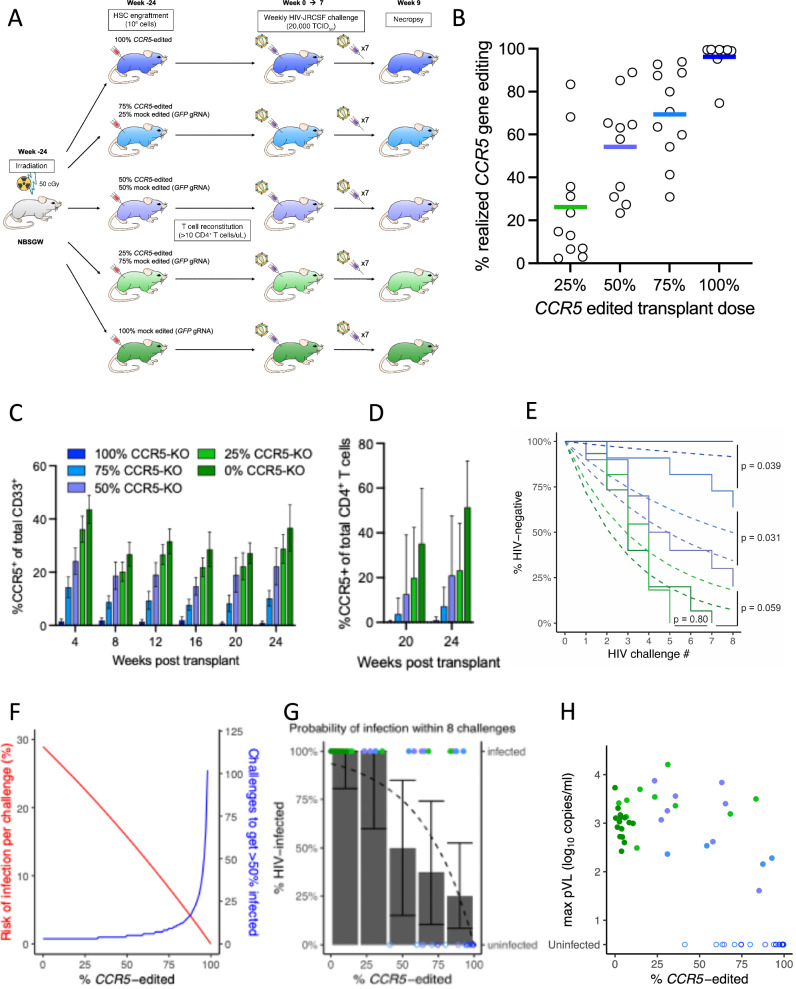
Fig. 7. Frequency of CCR5 editing determines risk of HIV infection.
A NBSGW mice were transplanted with 1 × 10⁶ HSPCs in five “doses” of CCR5 edited HSPCs with the balance of HSPCs comprising mock edited (GFP gRNA) cells ranging from 100% to 0%. Animals were monitored for frequency of CCR5 expression on relevant cell populations via flow cytometry at 1-month intervals for 6 months, then challenged weekly with 20,000 TCID50 of HIVJRCSF via the intraperitoneal route for 8 weeks. B CD19+ B cells were isolated from the bone marrow of HIV-challenged mice at necropsy and CCR5 gene editing in the human graft was quantified for each CCR5 edited HSPC transplant dose. Group means indicated by horizontal lines. C CCR5 expression levels in human CD33+ myeloid cells at monthly intervals following transplant for each HSPC titration group (n = 19 mice per group) and before HIV challenge. Bars represent mean and error bars denote ± SD. D CCR5 expression levels in CD3+CD4+ T cells 20 and 24 weeks after transplant and before HIV challenge (n = 15 mice per group). Bars represent mean and error bars denote + SD. E Plasma viral loads were monitored weekly for all mice via qRT-PCR. Kaplan–Meier curves for each study arm (solid lines) and corresponding expected survival curves based on the best fit mechanistic model assuming the “barrier at inoculation” mechanism (dashed curves). Statistics were generated by comparing each pair of transplant groups using the log-rank test. F Mechanistic model of the risk of infection per HIV challenge (red line) and the corresponding number of inoculations required to infect 50% of animals (blue line) as functions of the quantified frequency of CCR5 editing. G Observed percentage of animals infected after 8 HIV challenges for each quintile of frequency of CCR5 editing (bars with 95% confidence intervals) and the expected percentage of infection (dashed curve) based on the model in (F). Infection status of each animal after 8 challenges (solid or open points for infected or uninfected, respectively) indicated by the right-hand vertical axis. H Maximum viral load vs. %CCR5 edited.

