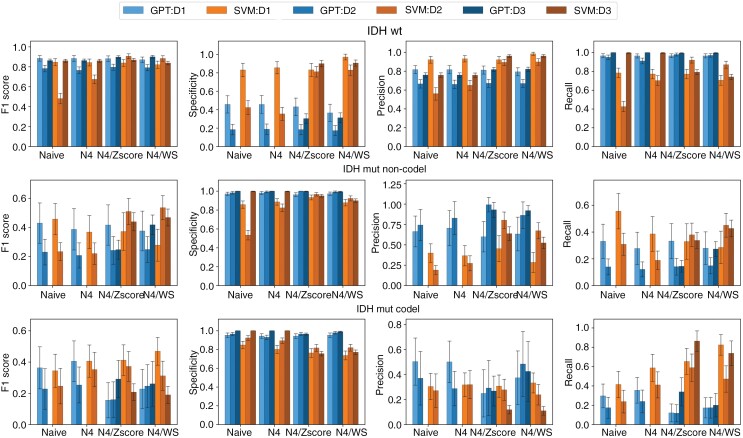
Figure 4.
Comparison of performance metrics between GPT and SVM models for the 3 glioma subtypes across different datasets and normalization methods (Naive, N4, N4/Zscore, and N4/WS). Each row represents 1 glioma subtype: IDH-wildtype (IDH-wt), IDH-mutant with 1p/19q-codeletion (IDH-mut codel), and IDH-mutant without 1p/19q-codeletion (IDH-mut non-codel). Each column corresponds to a specific performance metric: sensitivity, specificity, precision, and F1-score. The datasets include an internal testing set (D1) and 2 external datasets (D2 and D3). The bars in each plot are color-coded to differentiate the models and datasets. The error bar represents the SD calculated through bootstrapping. Abbreviation: SVM, support vector machine.

