
Figure 2.
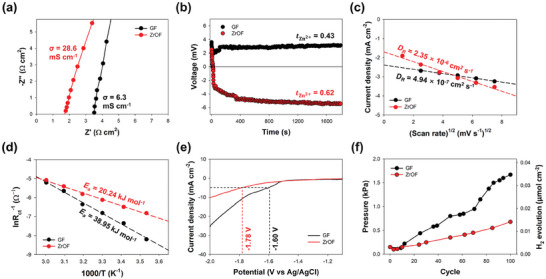
Electrochemical characterization of GF and ZrOF separators (black and red datapoints, respectively). a) Ionic conductivities calculated by EIS analysis performed using a symmetric stainless steel cell. b) Zn2+‐ion transference numbers are determined by measuring the liquid junction potential. c) Diffusion coefficients obtained from CV curves acquired at different scan rates. d) Arrhenius profiles obtained from Nyquist plots at different temperatures and corresponding activation energies. e) LSV curves for the hydrogen evolution reaction (HER) at a scan rate of 10 mV s−1. f) Quantitative measurement of pressure and corresponding hydrogen evolution as a function of cumulative cycles for Zn symmetric cell at 1 mAh cm−2 and 1 mA cm−2.