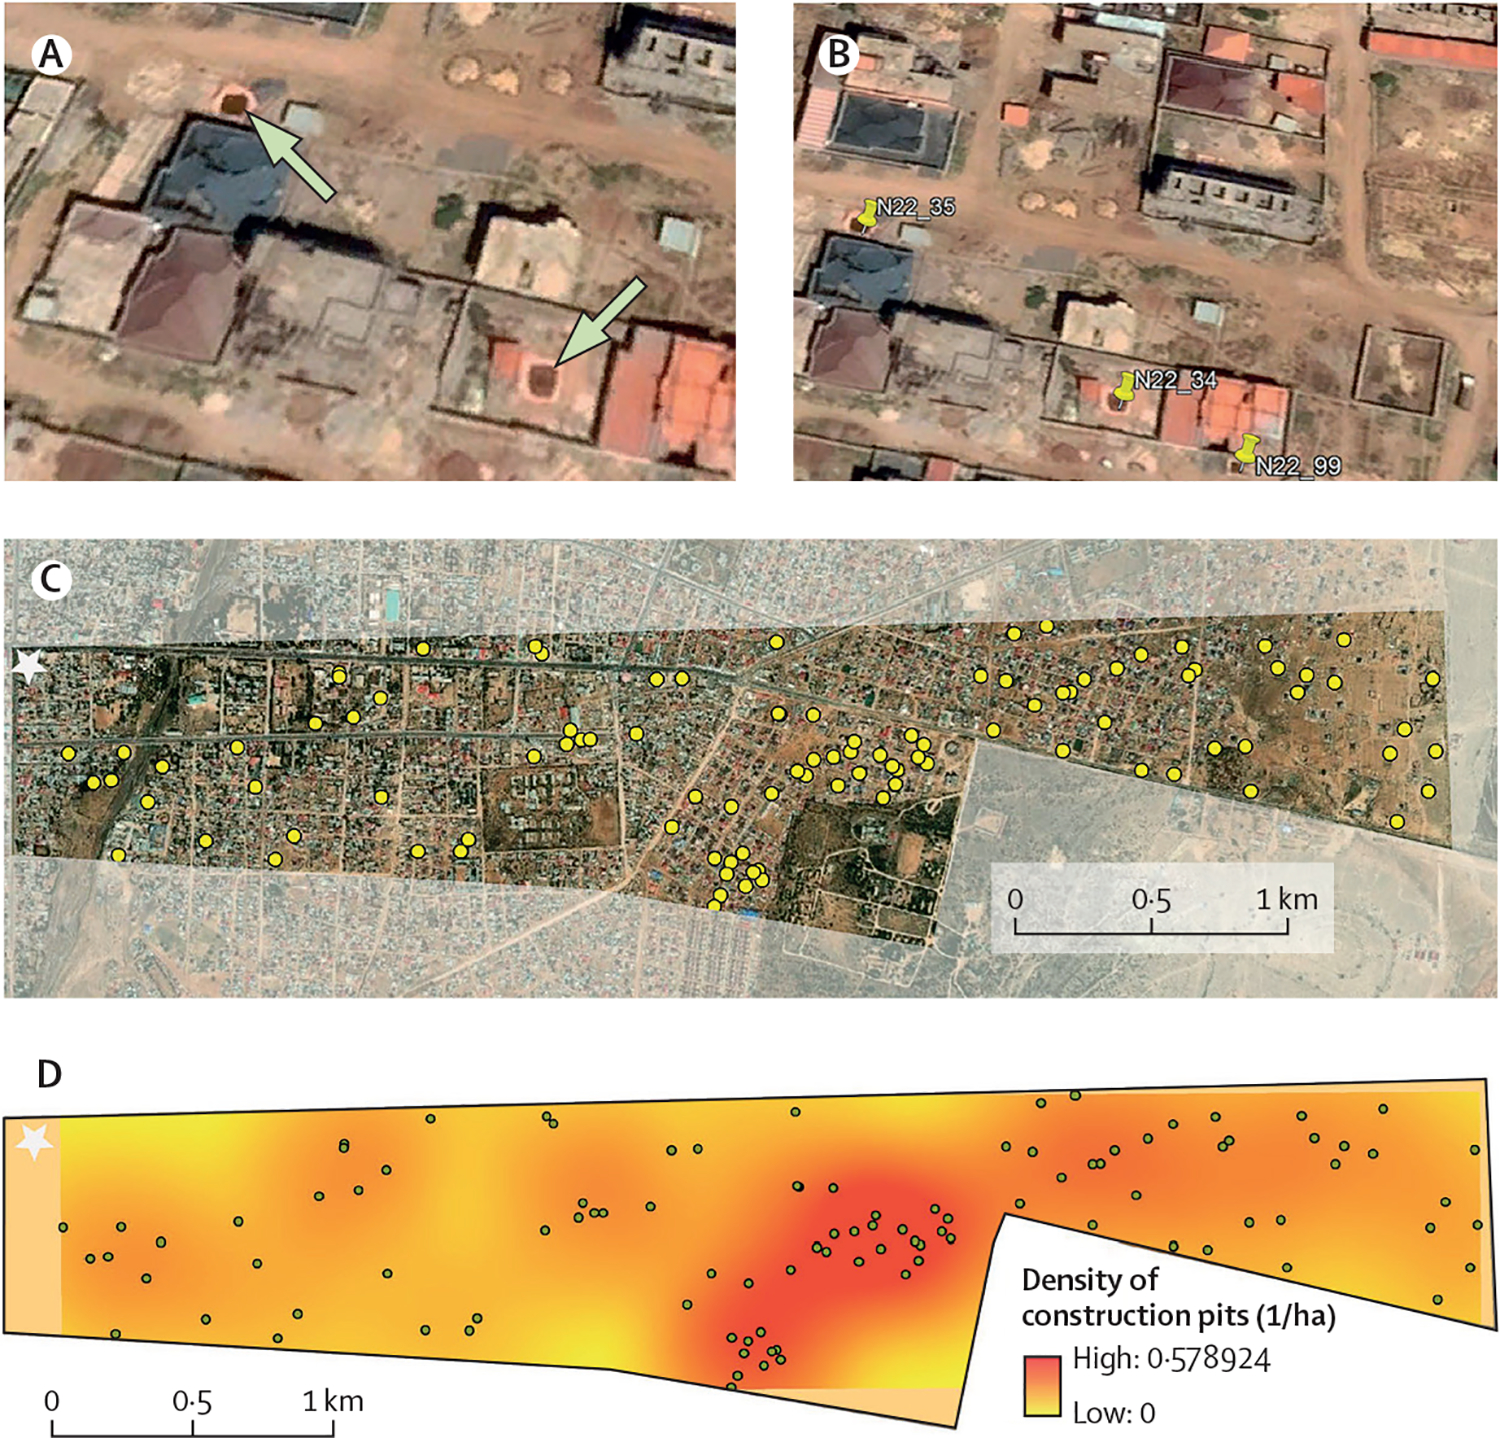
Figure 2: Construction pits can be mapped using high-resolution satellite imagery.

(A) Construction pits identified as positive for Anopheles stephensi larvae during March, 2023 in Jigjiga, Ethiopia (indicated by the arrows). (B) Use of Google Earth Pro to digitise all visible construction pits (a total of three pits are identified with a pin). (C) Distribution of the 101 construction pits visually identified in November, 2022, 4 months before our sampling, within a rural-urban swath measuring 4·3 km2 and centred on the highway connecting Jigjiga with Somaliland (one of the busiest corridors in the region). (D) Kernel density estimate of the density of construction pits per hectare (coloured surface) and location of all identified pits (dots) using a bandwidth of 500 m and a pixel size of 10 m. Stars in (C) and (D) indicate the location of Jigjiga’s downtown. Images (A–C) were sourced from ESRI World Imagery, MAXAR, and the GIS User Community.31
