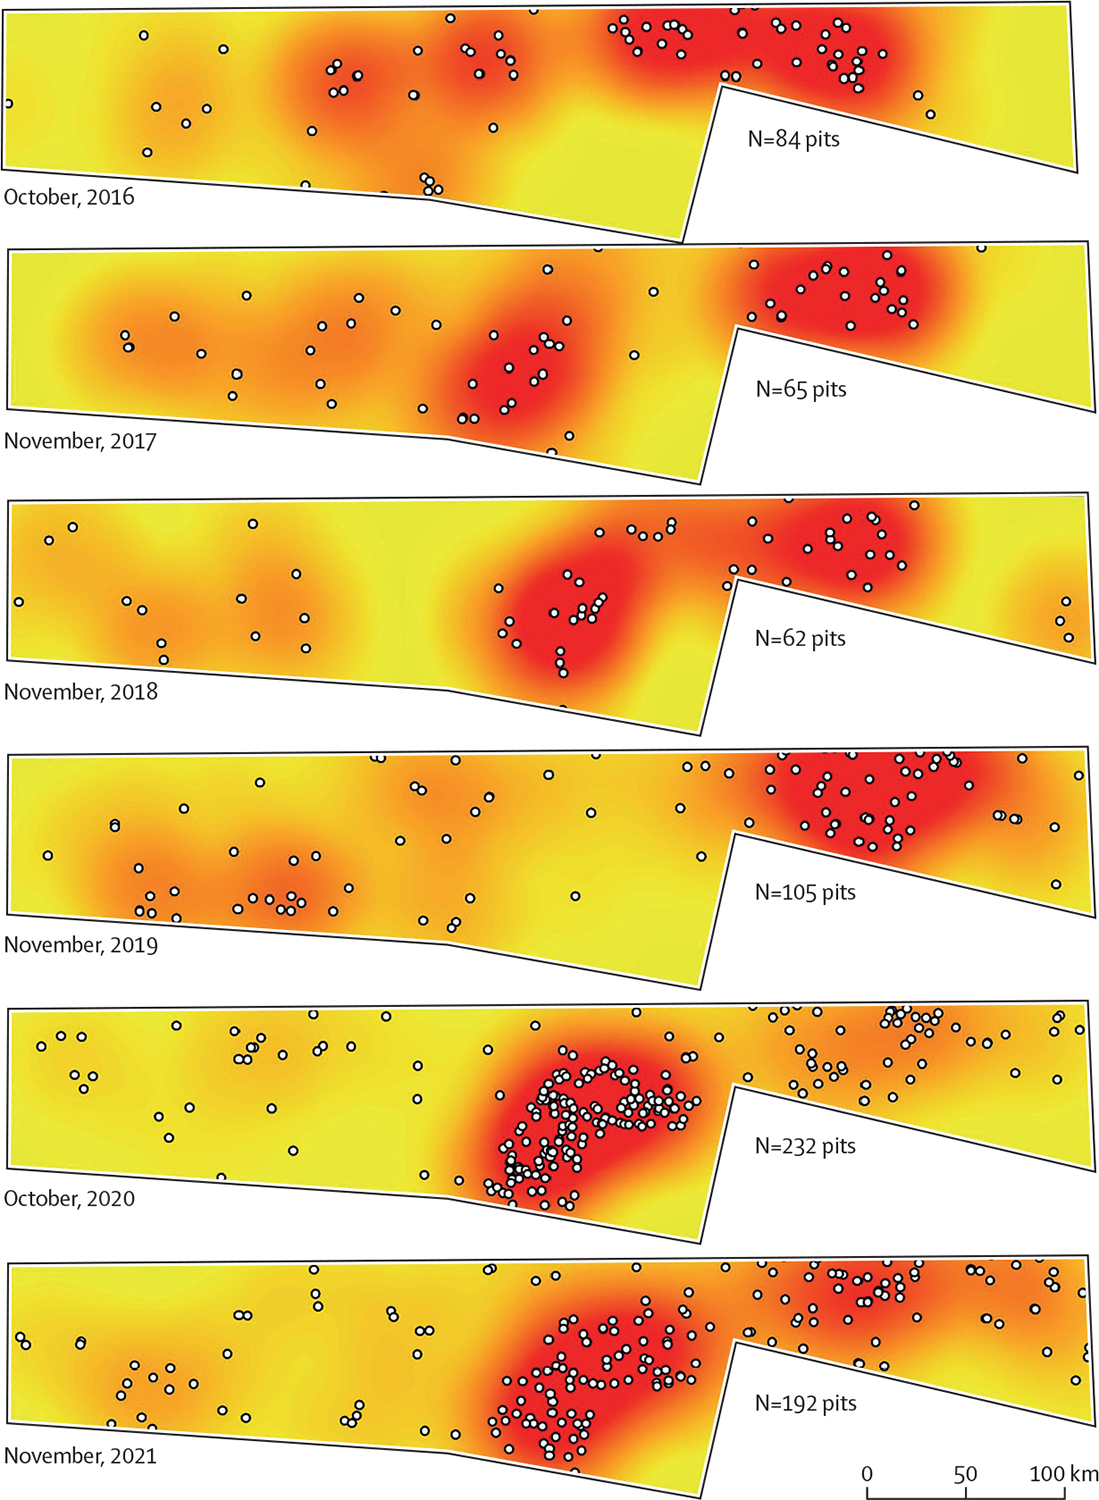
Figure 3: Historical sequence of the distribution of construction pits in an urban-rural swath of Jigjiga, Somali Region, Ethiopia.

The white dots represent digitised construction pits, observed with high-resolution satellite imagery historically archived in Google Earth. The surface was generated using kernel density function in ArcMap 10.8. For each year we used October–November, as they were the months that had most complete information.
