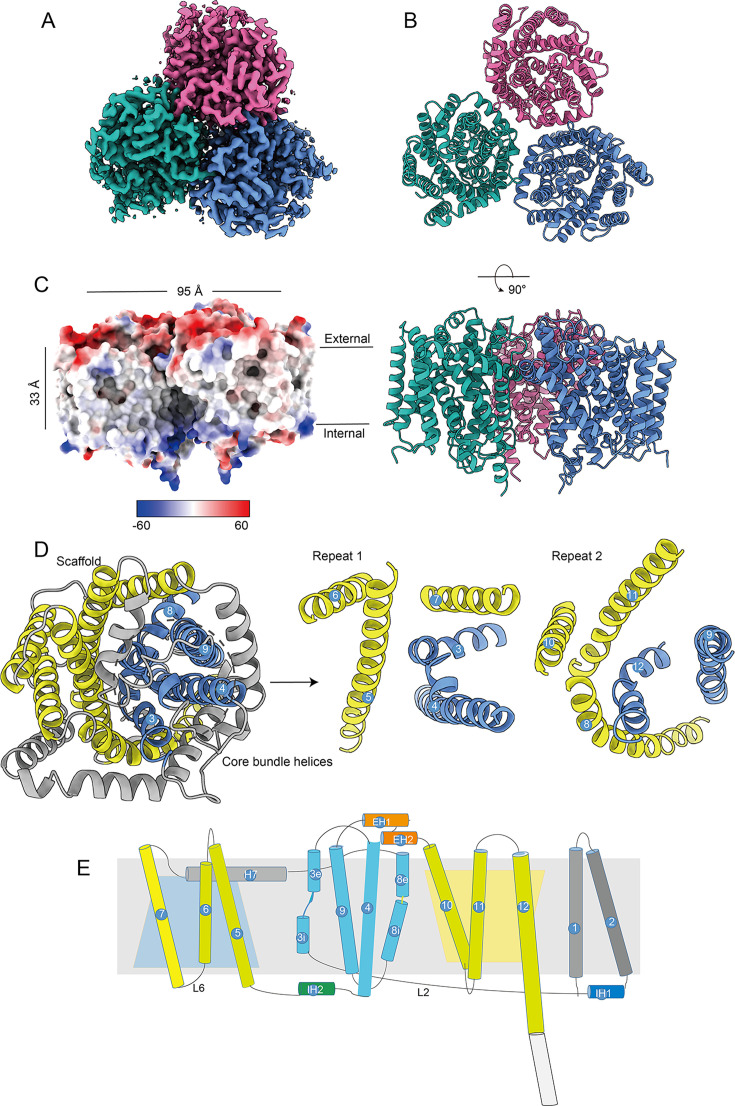
Fig 2.
Overall structure analysis of TmaT. (A) Cryo-EM density maps of TmaT. (B) The overall structures of TmaT trimer with the top view and side view. Different monomers are colored in blue, red, and green, respectively. (C) Electrostatic surface representation of TmaT. (D) Top view of one TmaT monomer with two inverted repeats. (E) Schematic view of the topology of TmaT. The corresponding transmembrane helices in two inverted repeats are colored consistently. TM1–2 colored in gray, TM3–4 and TM8–9 in cyan, TM5–7 and TM10–12 in yellow, respectively.

