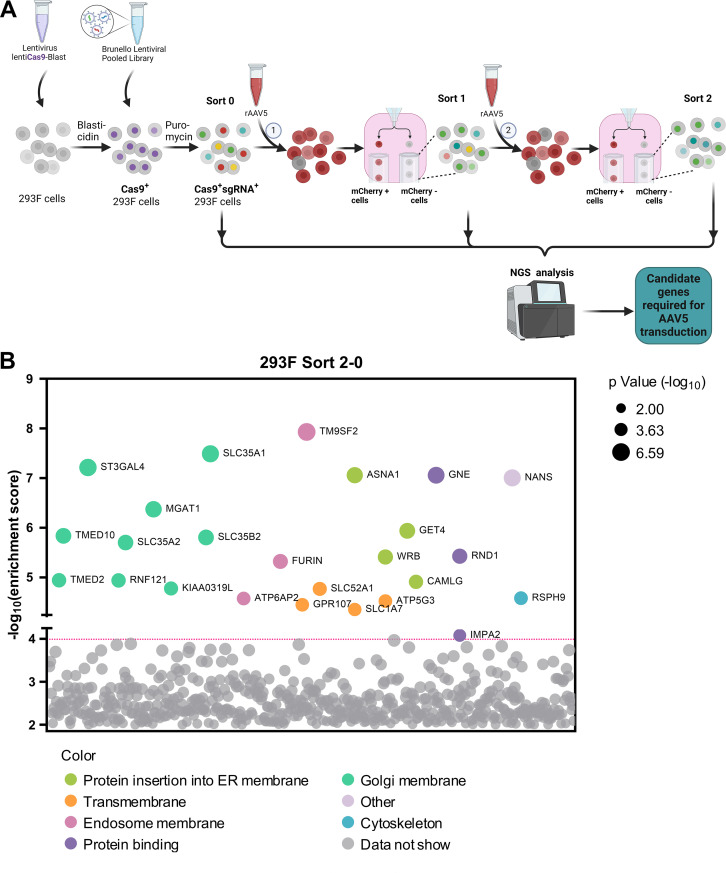
Fig 1.
The genome-wide CRISPR/Cas9 screen identifies host factors required for rAAV5 transduction. (A) Diagram of genome-wide CRISPR/Cas9 gRNA library screen. Suspension 293 F cells were transduced with a lentiviral vector carrying spCas9 and a blasticidin resistance gene followed by blasticidin selection. Blasticidin-resistant spCas9-expressing cells (1 × 10⁸) were then transduced with the Brunello lentiCRISPR gRNA lentiviral library and selected with puromycin to obtain Cas9/sgRNA-expressing 293 F cells. The selected cells were cultured and expanded to 2 × 10⁸. Among them, 1 × 10⁸ cells were harvested for genomic DNA (gDNA) extraction as the control (gDNASort0), whereas the other 1 × 10⁸ cells were transduced with mCherry-expressing rAAV5. Flow cytometry was performed at 3 days post-transduction (dpt), and the top 1% mCherry-negative (mCherry−) cells were collected and expanded to 2 × 10⁸ as the Sort 1 cells. We used 1 × 10⁸ cells from this population for gDNA extraction (gDNASort1), and another 1 × 10⁸ cells for the second round screening of rAAV5 transduction. The mCherry− cells from this round collected from cell sorting were expanded to 1 × 10⁸ for gDNA extraction (gDNASort2). The gDNA samples were subjected to NGS and bioinformatics analysis. (B) Enrichment of genes from the second round screen of mCherry− cells. NGS analyses were aimed at the sgRNA recognition sequences present in the mCherry− cell population, which identified the disrupted target genes at these sites. The x-axis represents genes targeted by the Brunello library, grouped by gene ontology analysis. The y-axis shows the enrichment score [-log10] of each gene based on MAGeCK analysis of the sgRNA reads in gDNASort2 vs. gDNASort0. Each circle represents a gene, with its size indicating the statistical significance [-log10] of enrichment when comparing gDNASort2 to gDNASort0. The color of each circle represents the function of the genes. Only genes with an enrichment score greater than 104 are shown.

