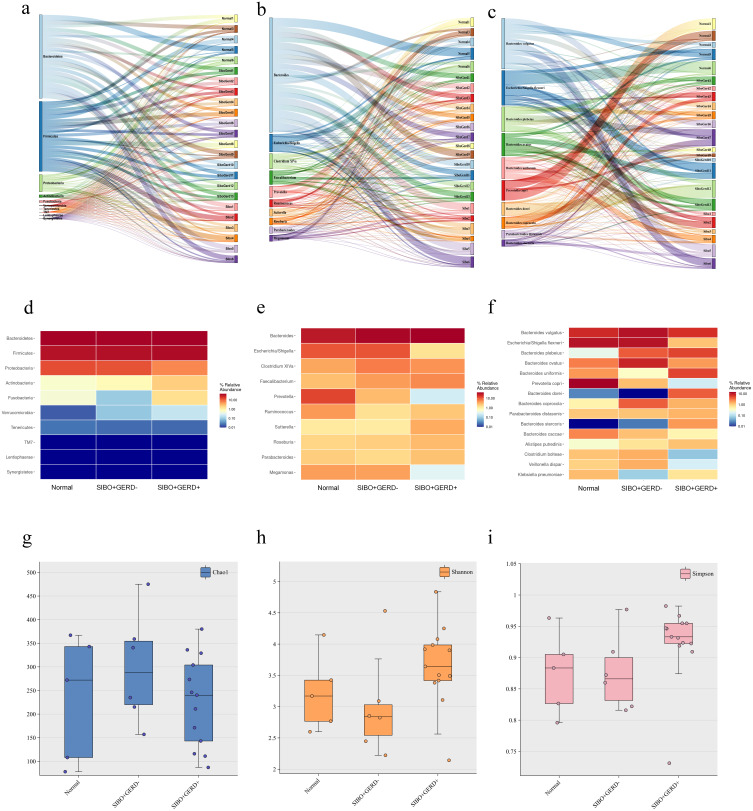
Figure 1.
Distribution of intestinal microbiome in a single sample at the phylum level (a), top 10 genera by abundance (b), and top 15 species by abundance (c). (d) Distribution of intestinal microbiome at the phylum level for each of the three groups, (e) top 10 genera by abundance, and (f) top 15 species by abundance. (g) Alpha diversity based on the Chao1 index between groups; (h) alpha diversity based on the Shannon index between groups; (i) alpha diversity based on the Simpson index between groups.

