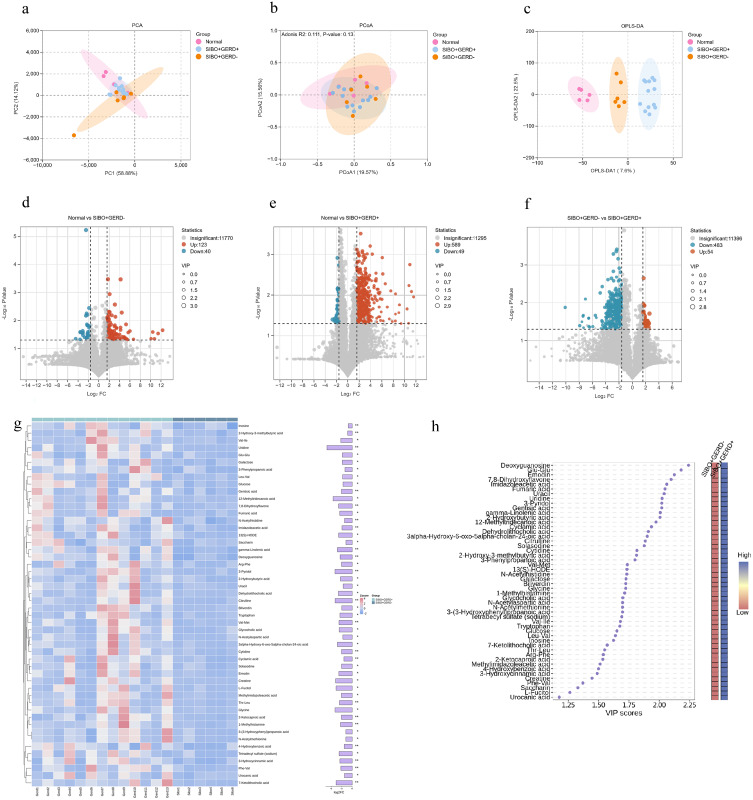
Figure 3.
Metabolomic analysis of gut microbiota metabolites in each group (*: p < 0.05; **: p < 0.01). (a) PCA based on intestinal microbiome metabolites; (b) PCoA plot based on intestinal microbiome metabolites; (c) OPLS-DA analysis based on intestinal microbiome metabolites. Volcano plots of differential metabolites among the three groups: (d) healthy control group vs SIBO+GERD-; (e) healthy control group vs SIBO+GERD+; (f) SIBO+GERD- vs SIBO+GERD+. (g) Heatmap of differential metabolites. (h) VIP scores of differential metabolites and corresponding heatmap.

