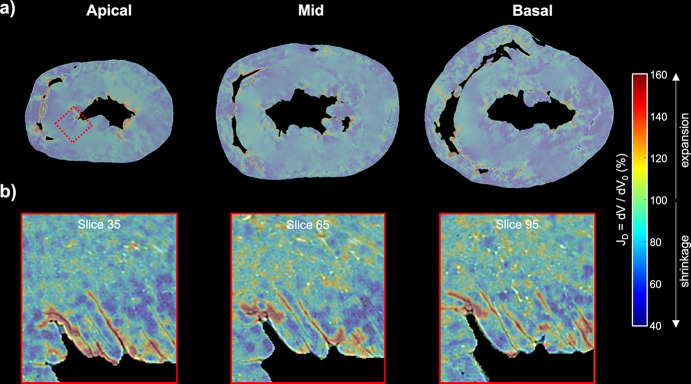
Figure 3.
Quantification of the local myocardial volume changes due to ethanol dehydration. (a) Colour maps of the local Jacobian determinants of the deformation field, JD, at three levels from base to apex, obtained after the non-rigid registration between the heart before and 342 h after ethanol immersion. (b) Local JD at three different image slices obtained after the non-rigid registration at full resolution within the ROI indicated with a dashed red rectangle. Reddish values indicated tissue expansion while blueish values indicated tissue shrinkage.

