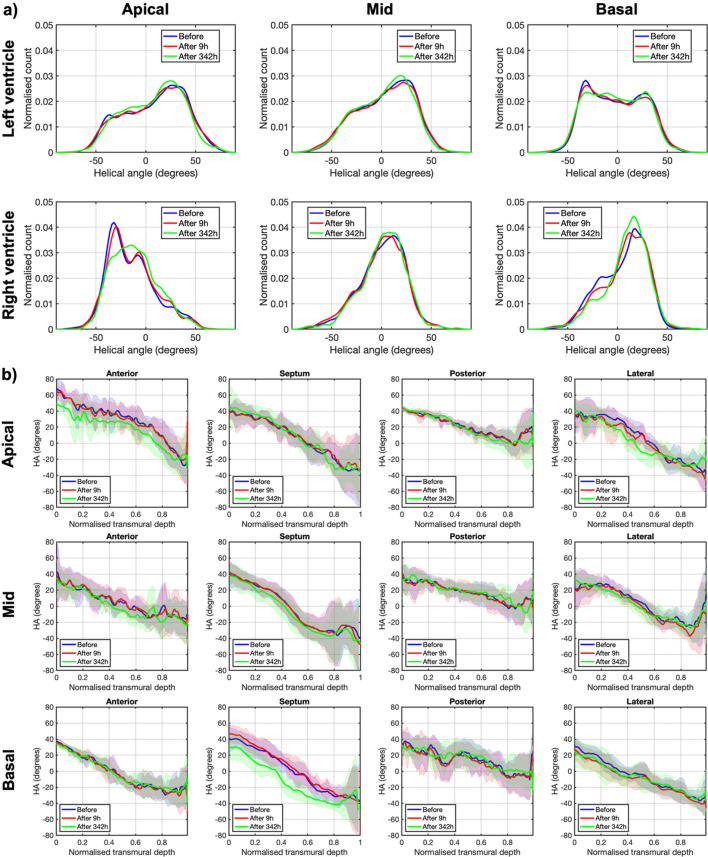
Figure 6.
Quantification of myocytes aggregates orientation via helical angle (HA). (a) Histograms of HA in the left ventricle (LV) and in the right ventricle (RV) across the basal, mid-ventricular and apical slices of the rat heart before (blue), 9 h after (red) and 342 h after (green) ethanol immersion. (b) LV transmural profiles of HA across four LV segments (anterior septal, posterior and lateral) in the same three apico-basal slices of the rat heart before (blue), 9 h after (red) and 342 h after (green) ethanol immersion. Solid lines: sample mean. Shadows: ± standard deviation.

