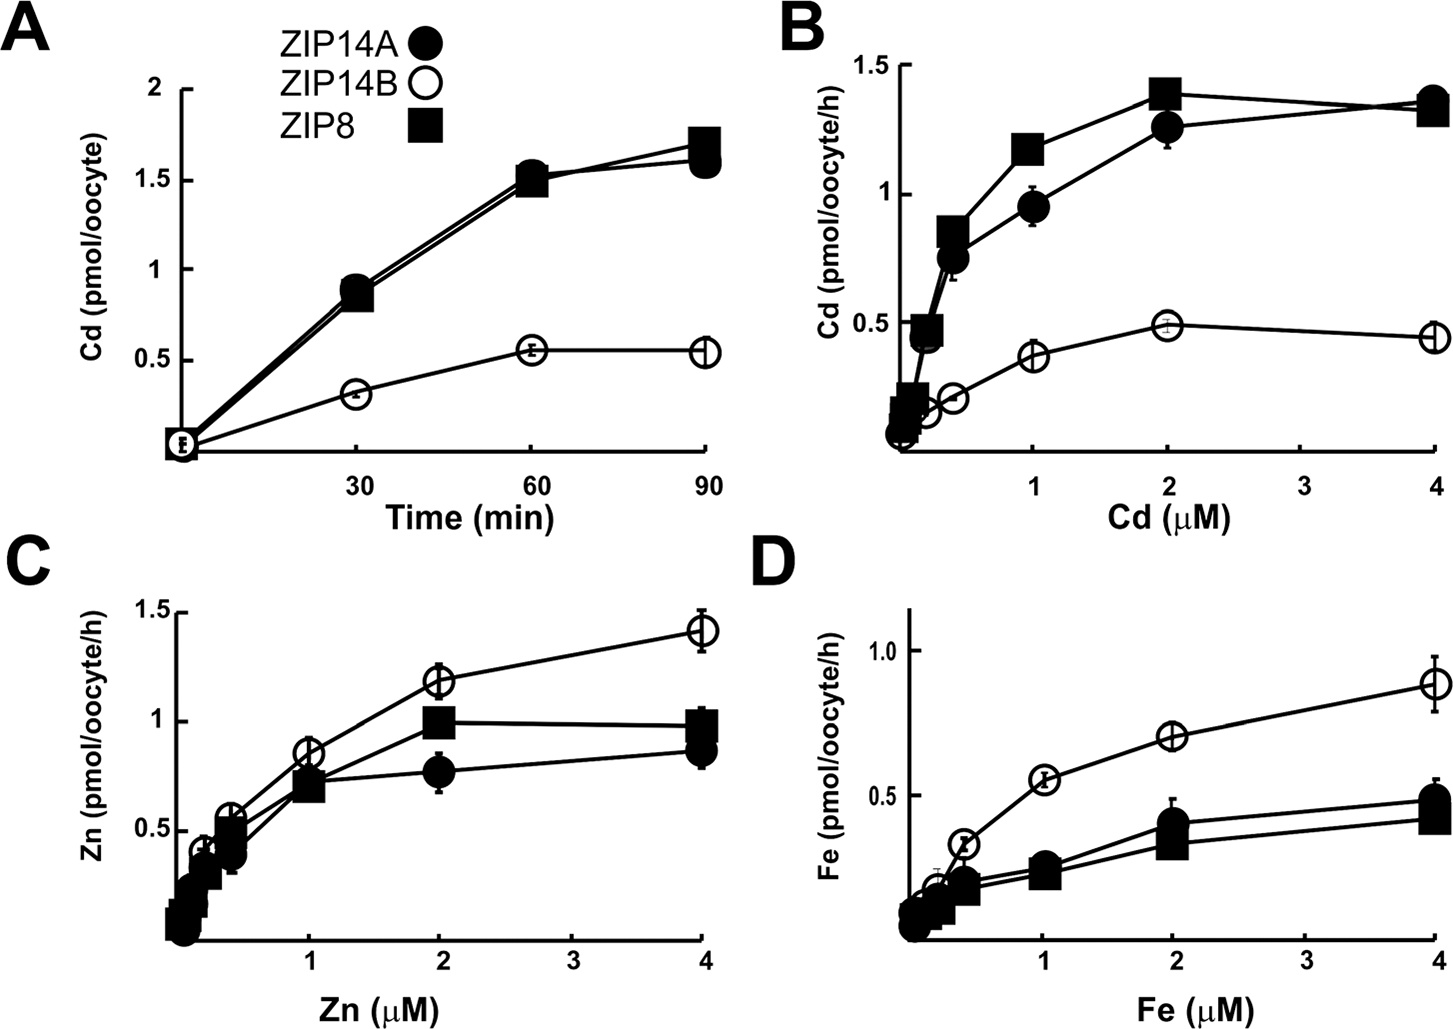
Fig. 3.

Divalent cation uptake kinetics by ZIP14A, ZIP14B and ZIP8. (A) Cd uptake as a function of time. In this and in subsequent panels, values of control oocytes (water-injected only) are subtracted from those of cRNA-injected oocytes. Metal uptake values in empty-vector-injected oocytes were similar to those by water-injected oocytes [data not shown]. (B) Cd uptake as function of concentration. (C) Zn uptake as a function of concentration. (D) Uptake as a function of concentration. In this and remaining figures, data are expressed as means (symbols) ± S.E.M. (brackets). Note different values on the Y-axes.
