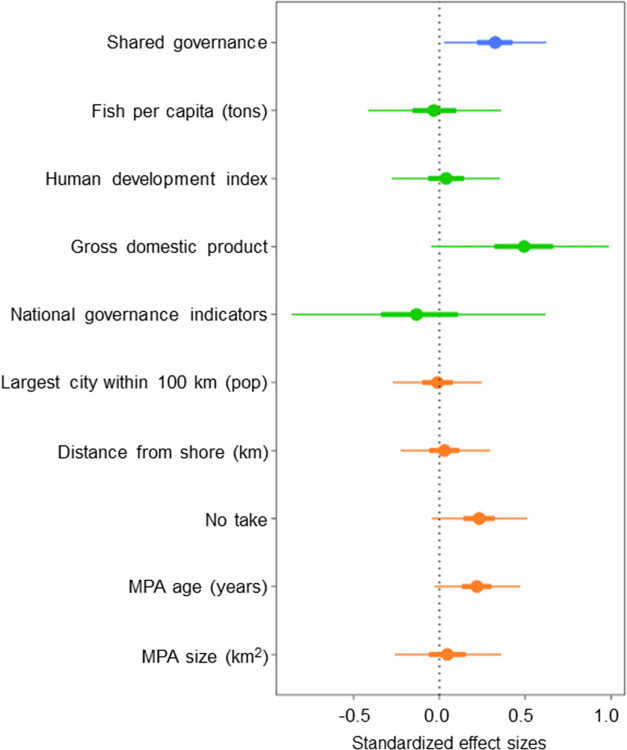
Fig 2. Effects of Model 1 covariates on fish biomass.
MPA governance (blue), country characteristics (green), and MPA characteristics (orange) on fish biomass difference. Response variables are log fish biomass differences and represent Bayesian posterior mean effect sizes (dot) with 95% Bayesian credible intervals (C.I.s, thin lines) and 50% C.I.s (thick lines). The baseline governance category in this model was state governance. The national governance indicators represent the World Bank governance indicators. No-take refers to the proportion of fish surveys conducted in no-take zone. See Table 2 for variable descriptions.

