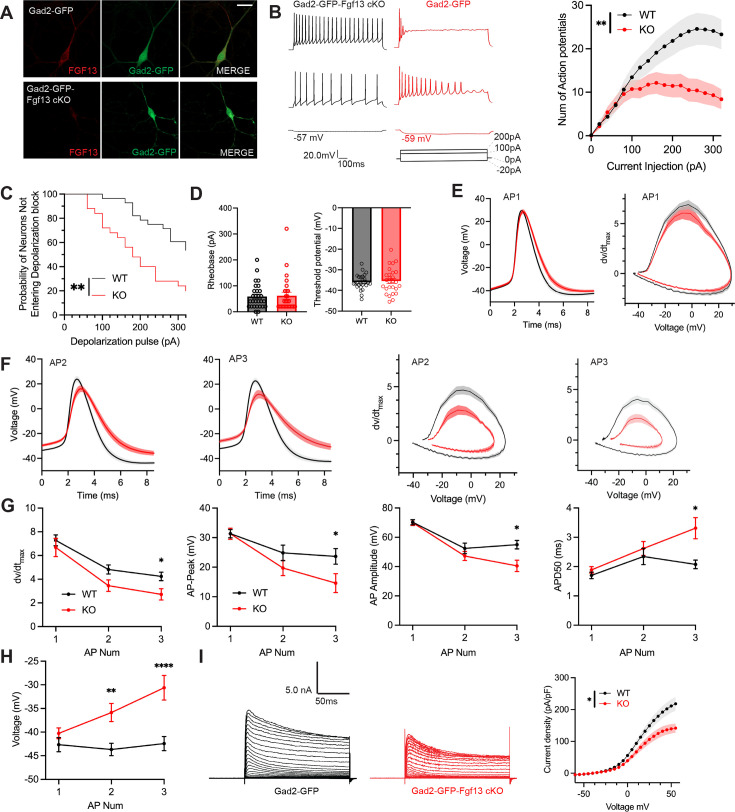
Figure 5. Inhibitory neuronal knockout of Fgf13 results in deficits of interneuron excitability.
(A) Examples of FGF13-stained neurons from primary hippocampal neuron cultures generated from Gad2-Cre wildtype (top) and Gad2-Fgf13 cKO (bottom) male mice (scale bar, 20 μm). (B) Example traces of AP spike trains from wildtype (left) and Gad2-Fgf13 cKO interneurons. Input-output curve shows decreased firing of evoked action potentials from Gad2-Fgf13 cKO interneurons (two-way ANOVA, **, p<0.01, WT N=4, n=28; KO N=4, n=26). (C) Gad2-Fgf13 cKO interneurons enter depolarization block at earlier current injections than wildtype interneurons (log-rank test, **, p<0.01). (D) Resting membrane potential, rheobase, and threshold potential for cultured wildtype and Gad2-Fgf13 cKO interneurons. (E) Action potential wave forms and phase plots (mean ± s.e.m.) for the first elicited action potential of the spike train for wildtype and Gad2-Fgf13 cKO interneurons. (F) Action potential wave forms and phase plots for the second and third action potentials of the spike train of wildtype and Gad2-Fgf13 cKO interneurons. (G) Analysis of the first three action potentials in the spike train show a decrease in the dV/dt max, a decrease in action potential (AP) peak, a decrease in AP amplitude, and an increase in APD50 by the third AP of Gad2-Fgf13 cKO interneurons (two-way ANOVA, *, p<0.05). (H) Analysis of the first three action potentials in the spike train show an increase in membrane potential at the end of the AP for Gad2-Fgf13 cKO interneurons (two-way ANOVA, **, p<0.01, ****, p<0.0001). (I) Example traces of K+ currents from wildtype and Gad2-Fgf13 cKO interneurons (left). I-V curve for K+ currents (right), (two-way ANOVA, *, p<0.05, WT N=3, n=26; KO N=5, n=29).


