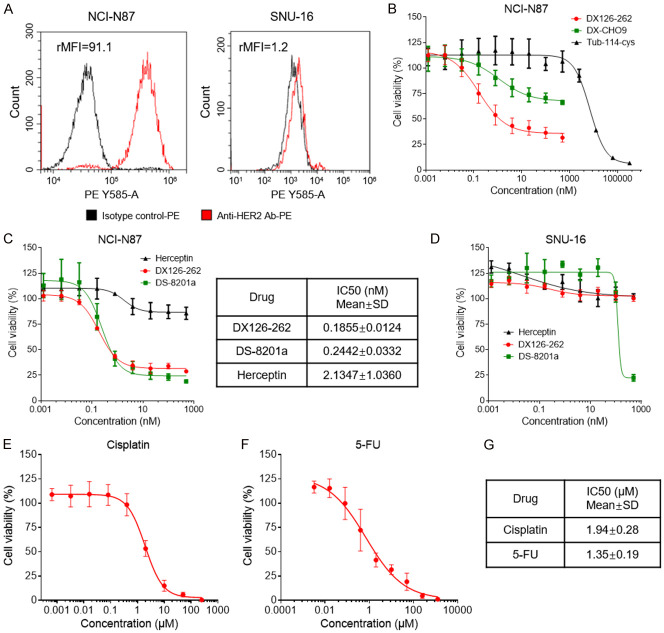
Figure 2.
HER2 expression and in vitro cell growth inhibitory activity in NCI-N87 and SNU-16 cell lines. (A) Flow cytometric analysis of HER2 expression at the cell surface of NCI-N87 and SNU-16 cells. Relative mean fluorescence intensity (rMFI) values for HER2 are shown above. (B) In vitro cell growth inhibitory activity in HER2-positive NCI-N87 cell line. The cells were treated with DX126-262, DX-CHO9, and Tub-114-cys for 5 days. Each point represents the Mean and SD (n=3). (C) In vitro cell growth inhibitory activity in the NCI-N87 cell line. The cells were treated with DX126-262, DS-8201a, and Herceptin for 5 days. The IC50 values were calculated by logistic regression using the GraphPad Prism software and shown in the table on the right. (D) In vitro cell growth inhibitory activity in HER2-negative SNU-16 cell line. The cells were treated with DX126-262, DS-8201a, and Herceptin for 5 days. (E, F) Cell viability determined using a Cell Counting Kit-8 (CCK-8) in NCI-N87 cells after exposure to Cisplatin (E) or 5-FU (F) at different doses for 5 days. (G) The IC50 value of the cell growth inhibitory activity of Cisplatin or 5-FU in NCI-N87 cells are shown as Mean ± SD. Each experiment was repeated at least 3 times.

