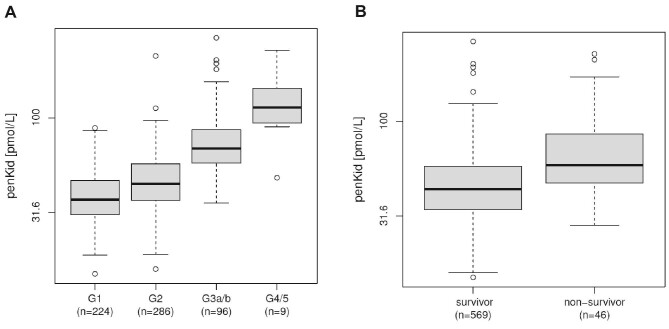
Figure 1:
(A) PenKid levels (pmol/l) at baseline in patients with eGFR >90 ml/min/1.73 m2 (G1), between 60 and 90 ml/min/1.73 m2 (G2), between 30 and 60 ml/min/1.73 m2 (G3a/b), and <30 ml/min/1.73 m2 (G4/5), P < .001, ANOVA all comparisons. (B) PenKid levels (pmol/l) at baseline in survivors compared to non-survivors (all-cause mortality) within 3 years.

