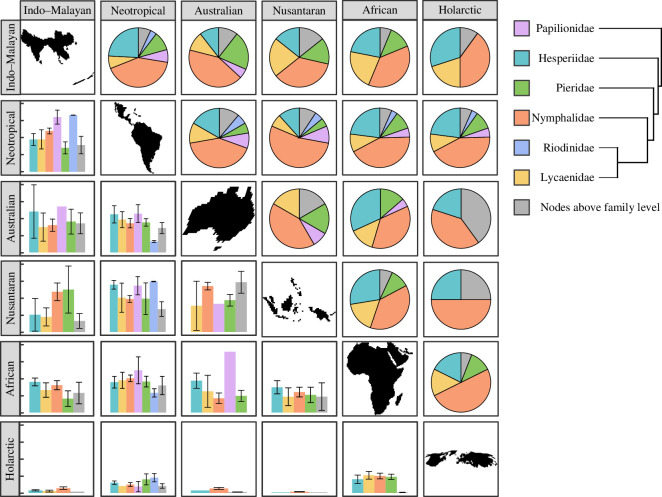
Figure 4.
Contributions of 83 potential ‘indicator’ butterfly clades to divisions between 6 biogeographic realms, totaling 411 pairwise comparisons. Colours represent nodes within families (including between and within subfamilies, tribes and genera) or older nodes above the level of family. Above the diagonal, each pie chart represents the relative contribution of each type of node to distinguishing between the pair of realms. Below the diagonal, bars indicate the mean R2 value in a model of specific overrepresentation score (SOS) response to realm identity across all the nodes within a group for each realm pair (electronic supplementary material, table S5). Y-axis tick marks correspond to 0.0, 0.25, 0.50, 0.75 and 1.00. Hedylidae, sister to Hesperiidae, is not shown because neither nodes within the family nor the node subtending Hesperiidae and Hedylidae contributed to divisions between realms.

