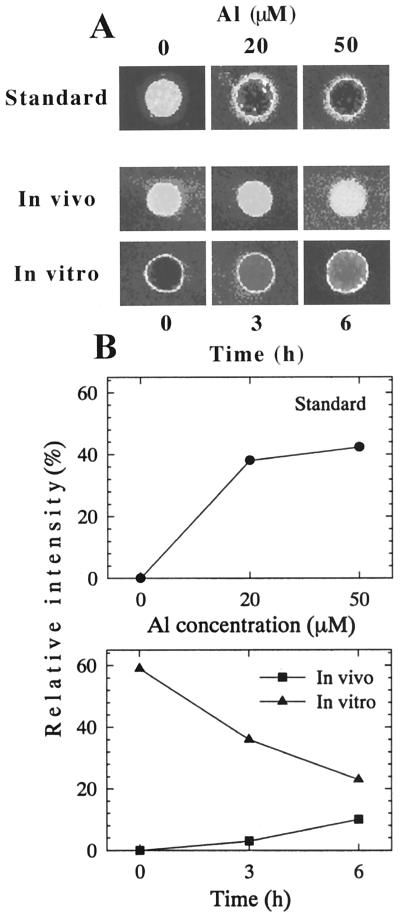
Figure 6.
Visualization of Al-induced alteration to the PM property and Al binding capacity of the isolated PM vesicles from squash root apex (0–5 mm) using the Morin assay. A, Calibration (standard) showing a range of Al concentration and the Al-induced fluorescence of control PM vesicles (top); after 50 μm Al treatment in vivo (middle); further addition of 50 μm in vitro (10 min) to the same PM vesicles (bottom). B, Quantitative evaluation of the Morin fluorescence based on the pixel intensity corresponding to images presented in A. Results of standard (top) and after in vivo and in vitro treatments (bottom). For details, see “Materials and Methods.”

