Figure 7.
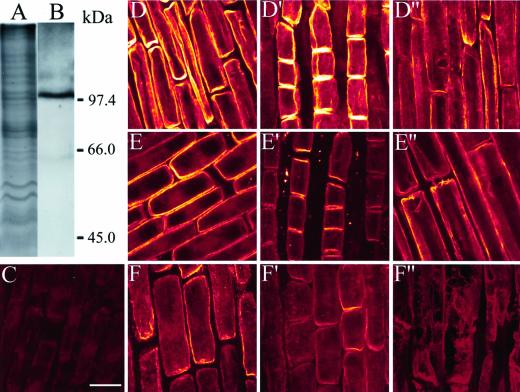
Analysis of the specificity of H+-ATPase antibody against the isolated PM proteins from squash root apex (10 mm). CB staining (A) and western blot (B). Localization of H+-ATPase in intact squash root apices (C–F"). Confocal images (for details, see text) of negative control of roots incubated without primary antibody (C). The plants were labeled with the antibody after 0- (D–D"), 3- (E–E"), and 6-h (F–F") Al (50 μm) treatments. The images are from the 2- to 3-mm DFT of epidermal cells (D–F), cortex (D′, E′, and F") and 7- to 8-mm DFT of epidermal cells (D", E", and F"). Note the decrease in the intensity of H+-ATPase upon time after Al treatments compared with control counterparts along the root apex. Bar = 40 μm.

