Figure 2.

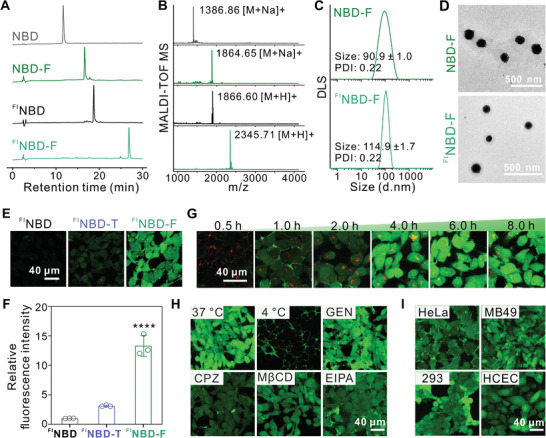
Characterization and intracellular delivery efficiency of fluorous NBD nanoparticles. A) HPLC spectra and B) MALDI‐TOF mass spectra of the unmodified NBD peptides and the fluorous‐tagged NBD peptides. C) DLS and D) TEM images of NBD‐F and FINBD‐F nanoparticles. E) Confocal images of 143B cells incubated with FINBD, FINBD‐T or FINBD‐F for 6 h at a NBD concentration of 10 µM. F) Quantification of fluorescence intensity in 143B cells corresponding to the images in E). n = 3. ****p < 0.0001. G) Confocal images of 143B cells incubated with FINBD‐F for different time. H) Confocal images of 143B cells incubated with FINBD‐F for 6 h after 1 h pretreatment with different inhibitors or at different temperatures. I) Confocal images of HeLa, MB49, 293, and HCEC cells incubated with FINBD‐F for 6 h at an NBD concentration of 10 µM.
