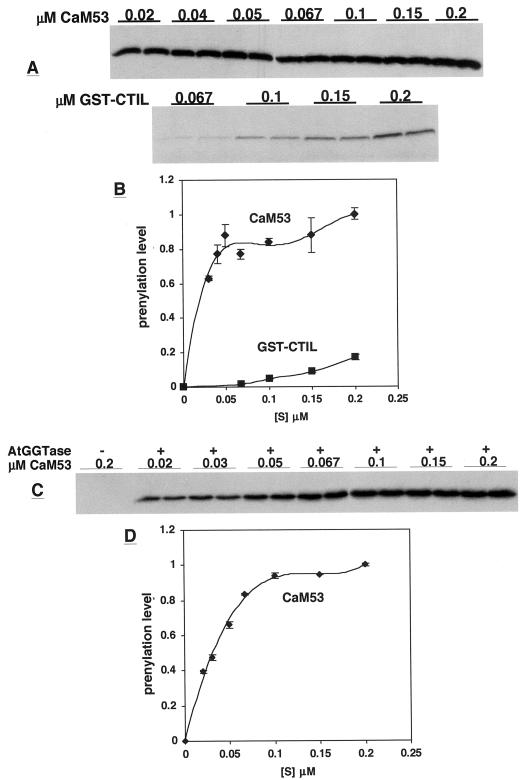
Figure 6.
Substrate saturation curves for prenylation of CaM53 and GST-CTIL by GGT-I. Prenylation reactions were carried out with concentrations of CaM53 and GST-CTIL as indicated on the figure. All other conditions were as described in “Materials and Methods.” Reactions were terminated by separating the protein products on SDS gels, which were, in turn, fluorographed and exposed to x-ray films (A and C). The fluorograms in A were exposed for 60 h, and the fluorogram in C for 48 h. C, −, Denotes reactions carried out with boiled GGT-I enzyme; +, reactions carried out with active GGT-I. B and D, Quantification of the bands on fluorograms in A and C, respectively. Values for each band pair were averaged, and the maximal intensity was given a value of 1. The kinetics of the prenylation of CaM53 appeared more accurate following a shorter (48 h) exposure period of the film (compare A and B with C and D). However, the radiolabeled GST-CTIL was barely detectable when films were exposed for less then 60 h (data not shown).

