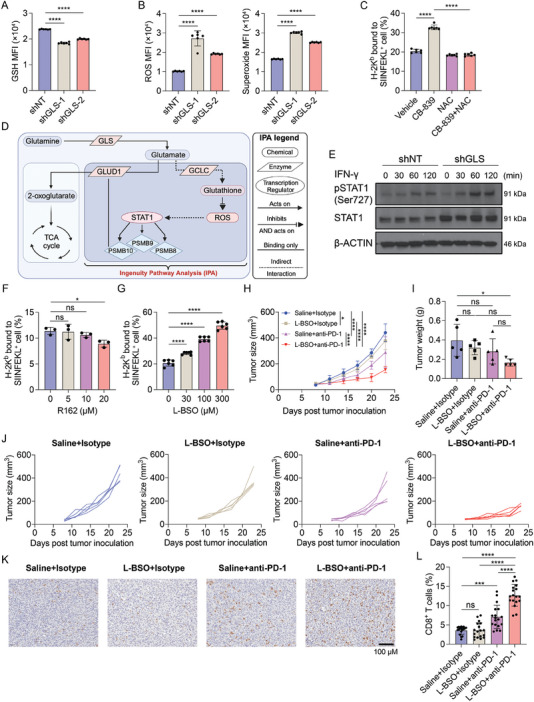
Figure 7.

Targeting Glu‐GSH flux enhances tumor antigen presentation and sensitizes CRC to anti‐PD‐1 therapy. A,B) GSH levels (A) and ROS and superoxide levels (B) were determined by flow cytometry in shNT and shGLS‐expressing MC38 cells. Data were analyzed using One‐way ANOVA and Dunnett's multiple comparisons test and presented as mean ± SD (n = 6). C) H‐2Kb mediated OVA presentation levels in MC38‐OVA cells treated with CB‐839 and/or NAC were determined by flow cytometry. Data were analyzed using one‐way ANOVA and Tukey's multiple comparisons test and presented as mean ± SD (n = 6). D) Ingenuity Pathway Analysis (IPA) pathway builder was used to construct the signaling pathways that connect ROS to the immunoproteasomes. The illustration was created with BioRender.com. E) Phosphorylated STAT1 and total STAT1 protein levels were determined using Western blotting in shNT and shGLS MC38 cells treated with IFN‐γ at the indicated time points, and β‐ACTIN was used as a loading control. F) H‐2Kb mediated OVA presentation levels in MC38‐OVA cells treated with R162 at the indicated doses were determined by flow cytometry. Data were analyzed using one‐way ANOVA and Dunnett's multiple comparisons test and presented as mean ± SD (n = 3), G) H‐2Kb mediated OVA presentation levels in MC38‐OVA cells treated with L‐BSO at indicated doses were determined and analyzed as in F). Data were presented as mean ± SD (n = 6). H–J) MC38 tumor growth in C57BL/6J mice. MC38 cells were inoculated subcutaneously into C57BL/6 mice. The tumor‐bearing mice were treated as indicated. The tumor sizes were monitored (H). The tumor weights (I) were taken at the endpoint. The growth curve of each tumor is shown in (J). (H) was analyzed using two‐way ANOVA and Tukey's multiple comparisons test, and (I) was analyzed using one‐way ANOVA and Tukey's multiple comparisons test, data were presented as mean ± SD (n = 5). K,L) Immunohistochemical staining of CD8 and the quantification in the tumors from the indicated four groups. One representative image from each group was shown. The quantification was analyzed using Image J on 18 images of each group. Data were analyzed using one‐way ANOVA, and Tukey's multiple comparisons test, presented as mean ± SD.
