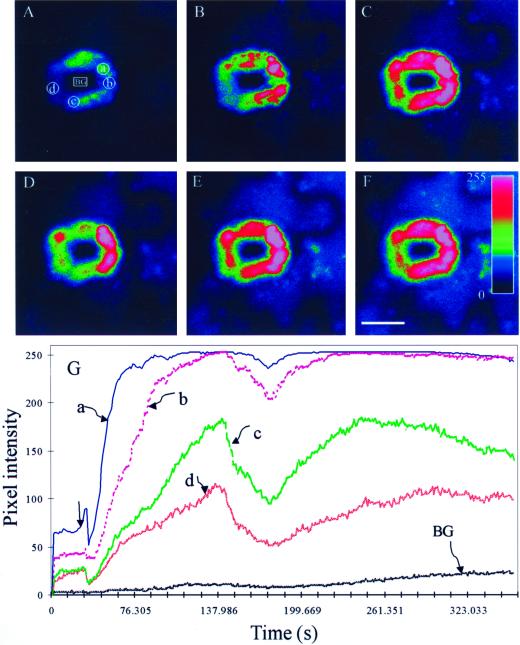
Figure 5.
Exogenous ABA-induced production of H2O2 in guard cells. A, A pair of guard cells loaded with DCFH-DA before the addition of 1 μm ABA. B through F, The same cells shown in A at 60, 120, 180, 240, and 300 s after the addition of 1 μm ABA, respectively. G, Time course changes in the pixel intensity of selected cytosolic regions as represented by the boxes in A. BG represents background fluorescence selected region of stomatal pore. The figures shows representative fluorescence image and time course from three independent experiments. The pseudocolor key is shown in the bar (F), which was applied to pixel intensity values (0–255) for all of the six fluorescence images. Scale bar represents 10 μm for all of the images. Arrow in G indicates the addition of ABA.

