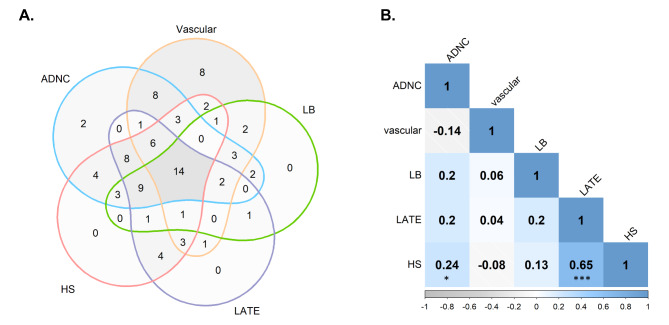
Fig. 1.
Associations between pathological burdens in the studied cohort. (A) Venn diagram showing the co-occurrence of high burdens for each neuropathology. High-burden thresholds are defined as specified in the Methods (Neuropathological Evaluation section). (B) Correlation matrix between included pathological stages, showing Spearman’s correlation coefficients and significance indicators: p < 0.05 (*) and p < 0.001 (***). ADNC = Alzheimer’s Disease Neuropathological Change; HS = hippocampal sclerosis of aging; LATE = Limbic Predominant Age-Related TDP-43 Encephalopathy; LB = Lewy body pathology

