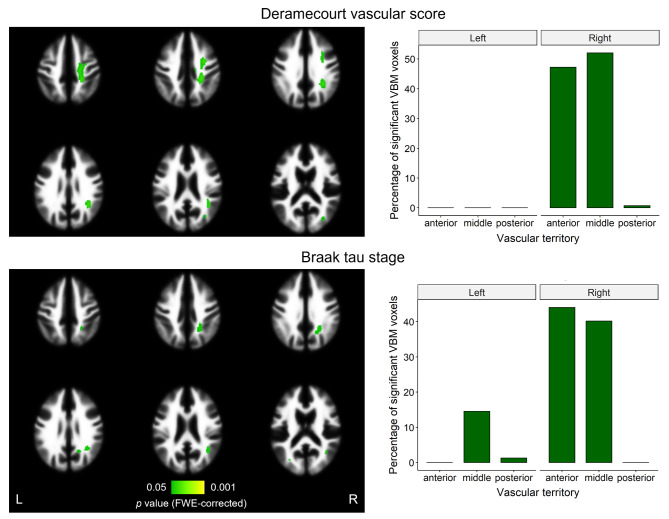
Fig. 5.
VBM results on WMH maps as a function of neuropathologies. After applying threshold-free cluster enhancement and FWE correction on the WM region, significant results (p < 0.05) were found as a function of Deramecourt vascular score and tau stage. On the left, significant effects (in green) are overlayed on the WM tissue probability map from SPM12, with left and right sides indicated. Colormap indicates FWE-corrected p values. On the right, the percentage of each of these significant effects falling into each region of the vascular territory atlas (regions perfused by anterior, middle, and posterior cerebral arteries) is shown. FWE = family-wise error; L = left; R = right; VBM = voxel-based morphometry; WMH = white matter hyperintensity

