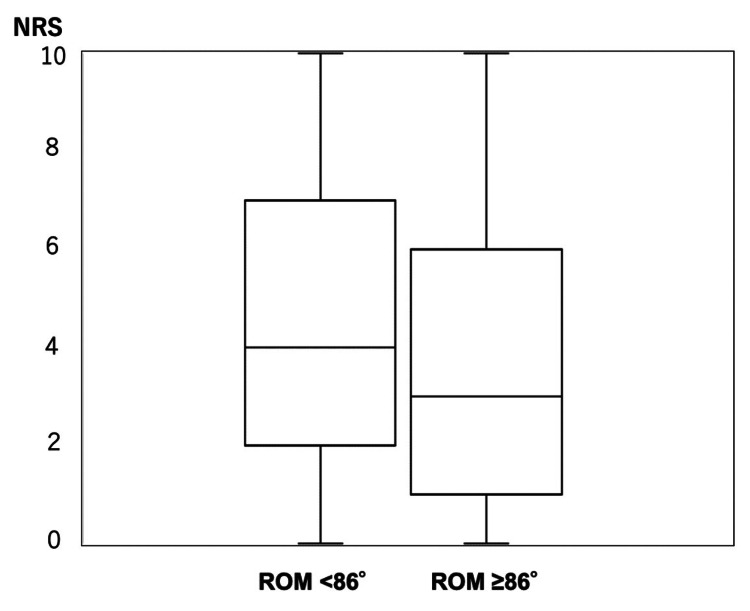
Figure 3. Relationship between Sleep Disturbance NRS and cervical ROM.
Within each box, horizontal lines denote median values; boxes extend from the 25th to the 75th percentile of each group's distribution of values; vertical lines extend to the maximum and minimum values.
NRS: numerical rating scale, ROM: range of motion

