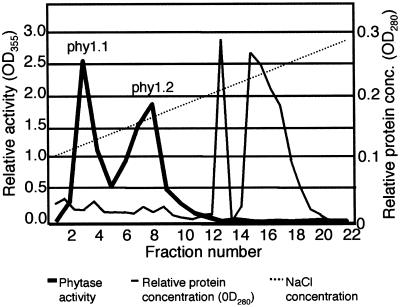
Figure 1.
Soybean phytase protein purification by monoQ anion-exchange chromatography. Two phytase activity peaks, phy1.1 and phy1.2, were observed. The heavy line shows phytase activity, the narrow line represents relative protein concentration, and the dotted line indicates the linear salt gradient used for elution.

