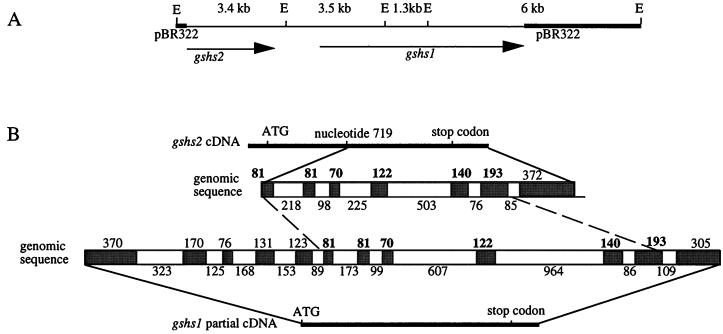
Figure 4.
Genomic organization of gshs1 and gshs2. A, Restriction map of the genomic clone G1-gshs showing the positions of EcoRI sites (E) and the sizes (in kilobase pairs) of EcoRI fragments. The arrows indicate the regions of the clone complementary to gshs1 and gshs2 cDNAs and the direction of transcription. B, The intron/exon structure of gshs1 and gshs2 genes. Size of exons (above) and introns (below) is indicated in base pairs. Conserved exons between gshs1 and gshs2 are indicated in bold.

