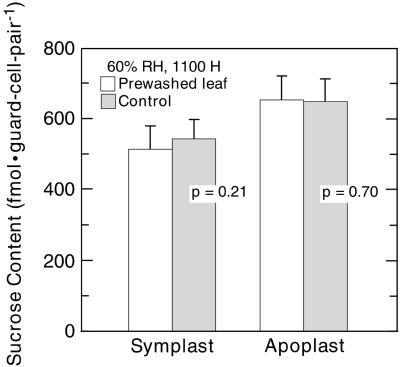
Figure 2.
Suc content of the guard cell symplast (left pair of columns) and of the guard cell apoplast (right pair of columns) of control leaflets (░⃞) and of leaflets that were washed before sampling (□). Samples were collected at constant 60% RH. n = 24 (three experiments). P values (t test) are for the paired columns; other details are as in Figure 1.

