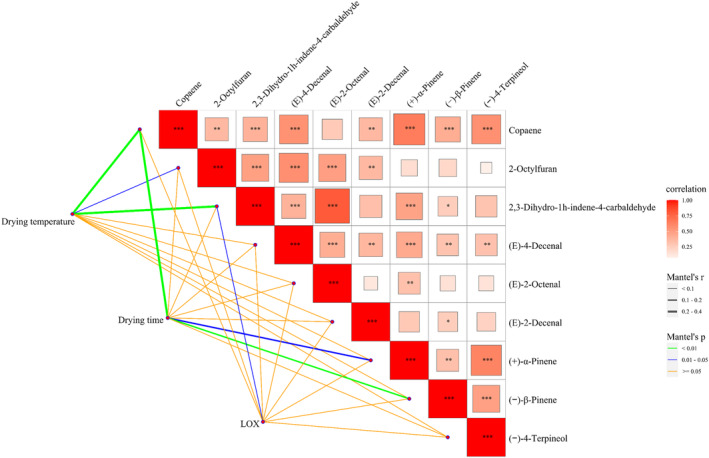
FIGURE 6.

The correlation analysis between differential metabolites and drying temperature, drying time, and enzyme activity by Mantel test. The upper right graph shows the correlation heatmap of nine differential metabolites. The color gradient denotes the correlation coefficients. The bottom left graph shows the Mantel test between the influencing factors (drying temperature, drying time, and LOX enzyme activity) and the differential metabolites. LOX, lipoxygenase.
