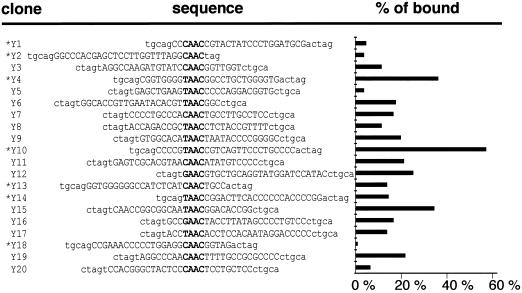
Figure 6.
Oligonucleotide sequences selected by NtMYBASΔC1 and relative binding affinity. Sequences of 20 oligonucleotides isolated after six rounds of selection with NtMYBASΔC1. The core binding sequence is in bold; lowercase letters represent the conserved oligonucleotide ends. Asterisks indicate that the sequence has been inverted. The percentage of bound oligonucleotide was quantified using a phosphorimager and expressed as the percentage of bound/total radioactivity in each lane.

