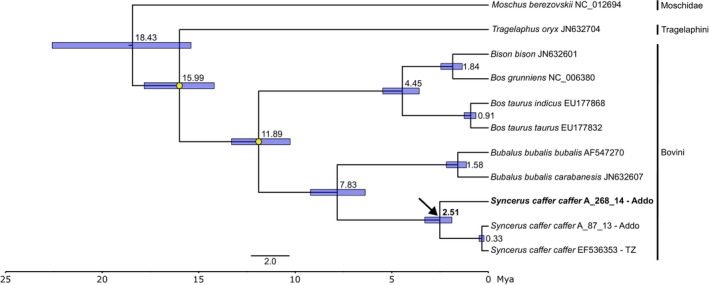
FIGURE 3.

Fossil‐calibrated, Bayesian phylogenetic tree of mitogenomes estimated in BEAST. Yellow circles show the fossil calibration points used. Numbers at the nodes show the estimated age of the node in millions of years. Node bars represent the 95% highest posterior density of the node age. All nodes have a posterior support of 1. The divergent Addo mitogenome is highlighted in bold text, with the arrow indicating the node where it diverged from other Cape buffalo mitogenomes. Mya, million years ago; TZ, Tanzania.
