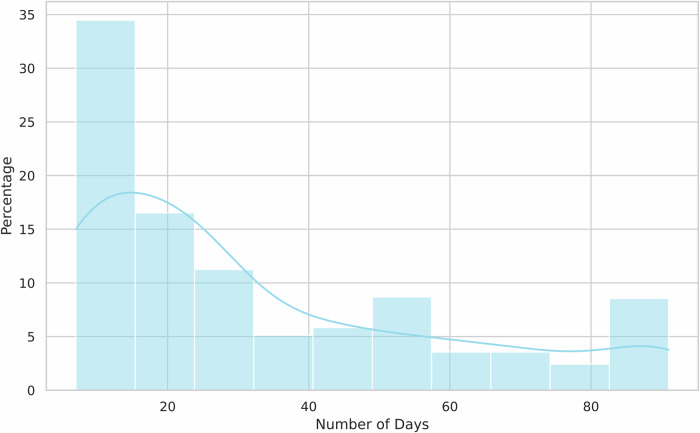
Fig. 4. The distribution of number of days between the first and last weight logs.
This histogram illustrates the distribution of the number of days between the first and last weight entries logged by users who participated in the study. The x-axis represents the number of days between logs, while the y-axis represents the percentage of users. The majority of users logged their weights over periods near the 33-day average, but the distribution reveals variability, with some users logging over shorter or longer timeframes.

