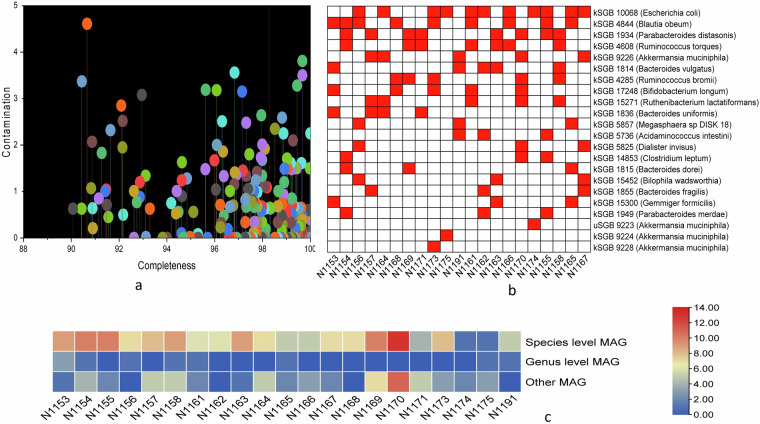
Fig. 6.
The distribution of meta genome assembled genome (MAGs) in each sample. (a) Indicated the completeness and contamination of 220 high-quality MAGs. Each color represented a single MAG, and the attached line indicated the percentage of contamination. (b) Represent the top known species level genome bins or MAGs in different samples. Here, red and white blocks mean the presence and absence, respectively. (c) Along with species-level MAGs, several genus-level and other lineage MAGs were also constructed and presented here. The color density bar on the right side indicated the number of specific level MAGs in different samples.

