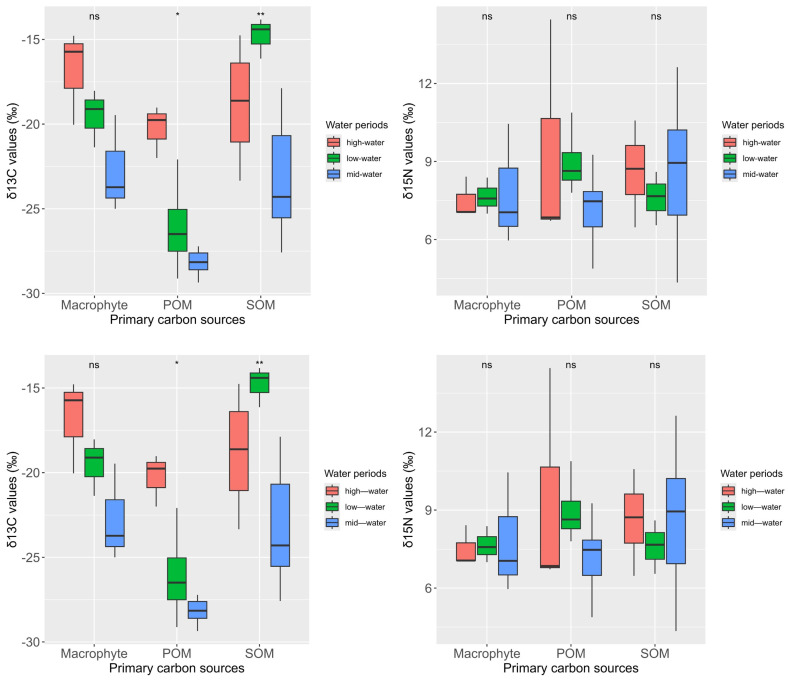
Figure 3.
Boxplot of δ13C and δ15N values for primary carbon sources (macrophyte, POM: particulate organic matter, and SOM: sedimentary organic matter) in Hongze lake. Box-plot representation: the horizontal line inside the box represents the median, and the lower and upper borders of the box represent the 25th and 75th percentiles, respectively. The upper and lower whiskers indicate the maximum and minimum range of the data excluding outliers. ns: no significant differences in the δ13C or δ15N values among water periods; *: p < 0.05; **: p < 0.01.

