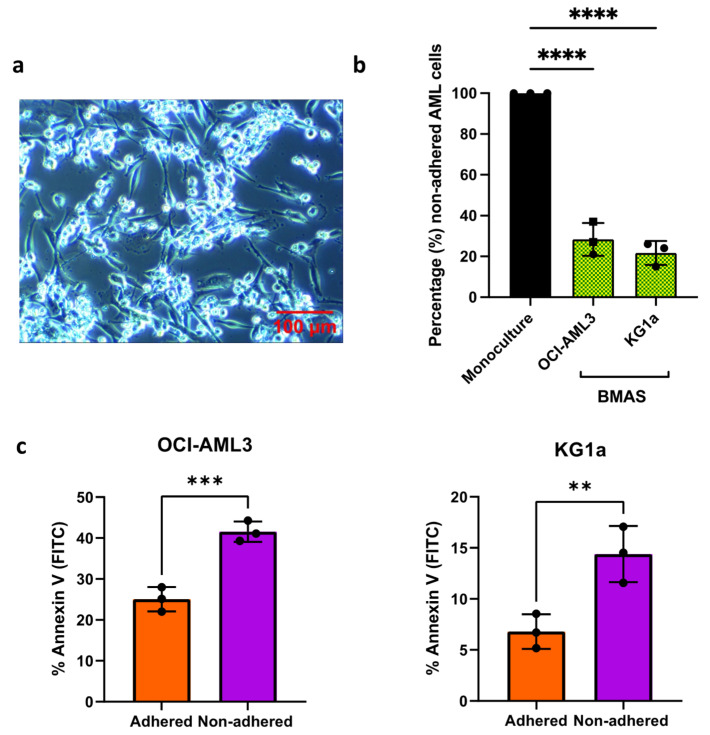
Figure 1.
The optimized BMAS. (a) The 10× magnification light microscopy images of co-culture. KG1a cells (bright round) attached to BMAS cells (darker and elongated). Images were captured using an Olympus CKX41 microscope, with a micropix camera and Tsview 7 version 7.1 software. (b) The number of non-adhered AML cells (mean ± SD) when co-cultured with ratio of 1:1:1 hFOB1.19/HS-5/HUVEC, KG1a cells (n = 3) and OCI-AML3 cells (n = 3) as a percentage of the number in monoculture. Significance determined using a one-way ANOVA, following the Shapiro–Wilk test for normality. (c) Percentage Annexin V-positive (apoptotic) adhered versus non-adhered OCI-AML3 (n = 3) and KG1a (n = 3) cells. Significance determined using paired t-test, following the Shapiro-Wilk test for normality. Significance determined using one-sample t-test, following the Shapiro-Wilk test for normality. **** p ≤ 0.0001, *** p ≤ 0.001 and ** p ≤ 0.01.

